How to Use TradingView for Bank Nifty Trading in 2026 — A Practical Setup Guide
By the Amuktha Trading & Investment Team | Updated April 2026
Bank Nifty is one of the most actively traded instruments on the NSE — and in 2026, TradingView has become the go-to charting platform for thousands of Indian intraday and options traders. But knowing that TradingView exists and knowing how to use it profitably for Bank Nifty are two very different things.
This guide gives you both. You will walk away with a proven chart setup, the five indicators that actually matter for Bank Nifty F&O, and a step-by-step intraday framework — the same approach our mentors at Amuktha have used with traders across India since 2013.
What makes Bank Nifty unique on TradingView in 2026?
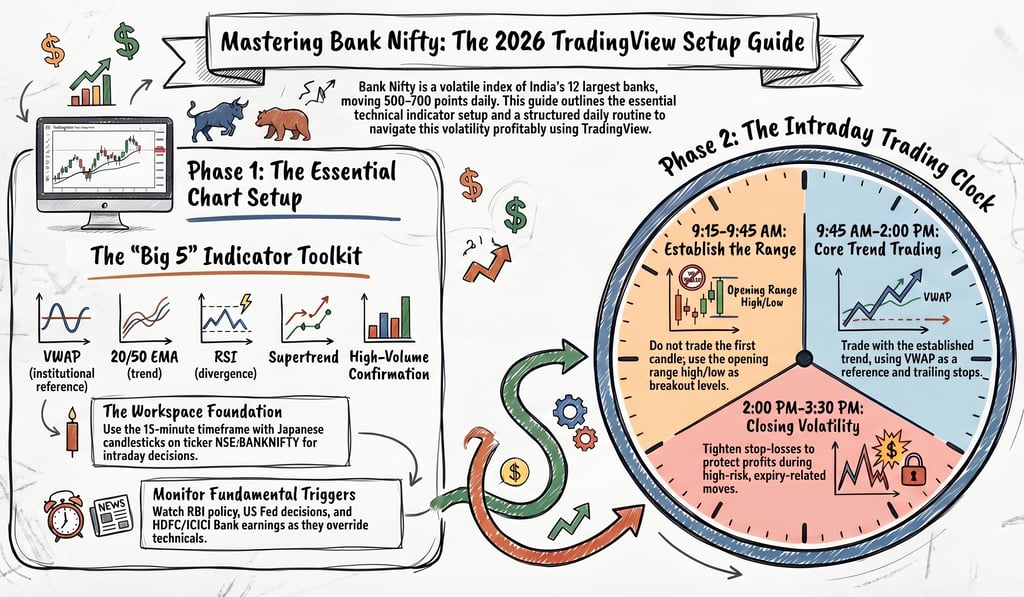
The NSE:BANKNIFTY index tracks 12 of India's largest banking stocks — HDFC Bank, ICICI Bank, SBI, Axis Bank, Kotak Mahindra Bank, and others. Because banks are the spine of the Indian economy, Bank Nifty reacts sharply to RBI policy decisions, inflation data, credit growth figures, and global events like US Federal Reserve rate changes or FII flows.
This creates a trading environment that is fast, volatile, and deeply pattern-driven. The average daily range of Bank Nifty in 2026 routinely exceeds 500–700 points — which means well-timed trades can generate significant returns, and poorly managed ones can destroy capital just as fast.
TradingView gives you the infrastructure to navigate this volatility with clarity. Here is how to build your setup from the ground up.
Step 1: Set up your TradingView workspace for Bank Nifty
Open TradingView and search for NSE:BANKNIFTY in the ticker search bar. This loads the spot index. For live options and futures work, also bookmark NSE:BANKNIFTY1! (the nearest futures contract).
Recommended chart settings:
Timeframe: Start with the 15-minute chart for intraday decisions. Use the 1-hour chart for trend context and the daily chart for weekly planning.
Chart type: Japanese candlesticks give the most information about price action — use them exclusively for Bank Nifty.
Pre-market: Enable extended hours if your broker provides pre-market SGX Nifty data to understand gap-up or gap-down expectations before 9:15 AM.
Step 2: The five indicators that actually work for Bank Nifty in 2026
Most traders clutter their charts with a dozen indicators and end up paralysed. Over years of mentoring traders across India, Amuktha has refined a clean, high-signal setup using just five tools:
1. VWAP (Volume Weighted Average Price) VWAP is the single most important intraday indicator for Bank Nifty. Institutional traders — FIIs, domestic MFs, large proprietary desks — use VWAP as their reference price. If Bank Nifty is trading above VWAP after 10 AM and holding that level on a pullback, that is a high-probability long setup. Below VWAP with rejection = short bias. In TradingView, add VWAP from the Indicators menu and set it to reset daily.
2. 20-EMA and 50-EMA on the 15-minute chart The 20-period exponential moving average acts as a dynamic support or resistance during trending sessions. When Bank Nifty holds above the 20-EMA across three consecutive 15-minute candles, the intraday trend is bullish. A clean bounce off the 50-EMA is often a higher-quality entry for CE buying. When both EMAs are pointing down and price is below them, stay in puts or stay out.
3. RSI (Relative Strength Index) — period 14 Use RSI not to find "overbought" and "oversold" levels in isolation, but to spot divergence. If Bank Nifty makes a new intraday low but RSI makes a higher low, that is a bullish divergence — a reversal signal that frequently precedes sharp bounces. RSI above 60 during a trending session confirms momentum.
4. Supertrend (ATR 10, Factor 3) The Supertrend indicator is particularly reliable on Bank Nifty's 15-minute chart. When the signal flips from red to green (a buy crossover), it often marks the beginning of a 200–400 point intraday move. Pair Supertrend flips with VWAP position for double confirmation before entry.
5. Volume profile (or just volume bars) Bank Nifty moves on volume. A breakout above a resistance level with below-average volume is a trap. A breakout with volume 1.5x or more above the 20-bar average is genuine. Watch volume in the first 30 minutes (9:15–9:45 AM) — the opening range established in this window with high volume sets the floor and ceiling for most of the day.
Step 3: The Amuktha intraday framework for Bank Nifty — 2026 edition
Here is the structured routine our mentors follow and teach:
Before the market opens (8:30–9:10 AM) Check SGX Nifty for global cues. Review the previous day's Bank Nifty closing structure — was it a trending close or a reversal candle? Note the key levels: previous day's high, low, close, and the major support/resistance zones from the weekly chart. Identify any RBI communication, US Fed data, or FII flows due that day.
Opening 30 minutes (9:15–9:45 AM) Do not trade blindly in the first candle. Let Bank Nifty establish its opening range. The high and low of the first 15-minute candle often define the breakout levels for the session. A break above the opening range high with volume = bullish entry. A break below the opening range low = bearish entry.
Core trading session (9:45 AM–2:00 PM) This is your primary window. Trade with the trend identified in the opening range. Use VWAP as your real-time reference. Trail stops using the 20-EMA. Avoid trading in the 12:00–1:00 PM dead zone when Bank Nifty typically consolidates with low volume.
Closing session (2:00–3:30 PM) The last 30 minutes can be volatile due to expiry-related activity (especially on options expiry Thursdays). If you are carrying a position into this window, tighten your stop-loss. New fresh entries in the last 30 minutes carry elevated risk.
Key levels to watch on Bank Nifty in 2026
Bank Nifty's major structural levels in 2026 have been shaped by the RBI's rate decisions, FII repatriation patterns, and the post-correction recovery from the early 2026 lows near 50,000. Traders should be aware of the 55,000–56,000 zone as a key resistance area, and 52,000–51,500 as a strong demand zone based on current market structure.
For weekly planning, always note:
The previous week's high and low (strong S/R levels)
The monthly expiry level (last Thursday of the month for Bank Nifty)
RBI policy dates — Bank Nifty can move 1,000+ points on RBI day within minutes
Bank Nifty options trading on TradingView: what to look for
If you trade Bank Nifty options (CE/PE), TradingView helps you in three critical ways:
Option chain context via chart structure: While TradingView does not show the full NSE option chain, you can read price action signals that confirm or contradict what the option chain is telling you. A high Put OI at a strike level that Bank Nifty is approaching = strong support. Price action holding above that level on TradingView confirms the support.
PCR and sentiment: The Put-Call Ratio (PCR) is a powerful sentiment gauge. A PCR below 0.7 indicates excessive call buying and a market that may be over-extended bullishly. A PCR above 1.2 signals fear. Use these extremes as contrarian inputs when your chart also shows a reversal setup.
ATM straddle pricing: On expiry days, experienced traders watch the ATM (at-the-money) straddle price to estimate the expected range for the session. If the straddle is priced at ₹200, the market is implying a ±200 point move. Set your TradingView alerts accordingly.
How RBI and macroeconomic data move Bank Nifty in 2026
No Bank Nifty trader can afford to ignore fundamental triggers. These are the events that override all technical setups:
RBI Monetary Policy Committee (MPC) meetings: Rate cuts are broadly bullish for Bank Nifty as they improve the net interest margins of constituent banks. Rate hikes compress margins. In 2026, the RBI's stance on liquidity and the repo rate continues to be the single biggest catalyst for Bank Nifty's weekly trend direction.
US Federal Reserve decisions: FII flows into Indian equities are directly influenced by US interest rates. When the Fed signals cuts, foreign money flows into emerging markets including India, lifting Bank Nifty. When the Fed tightens, FIIs pull out and Bank Nifty falls.
India's GDP and credit growth data: Strong credit growth numbers signal healthy banking sector performance and are bullish for Bank Nifty's constituent stocks.
Quarterly earnings of HDFC Bank and ICICI Bank: These two stocks together carry approximately 50% weightage in the Bank Nifty index. Their quarterly results frequently cause 300–600 point gap moves at the open.
Common mistakes traders make on Bank Nifty — and how to avoid them
After training hundreds of traders, Amuktha's mentors have observed the same patterns of avoidable loss:
Trading without a defined stop-loss: Bank Nifty moves 500+ points on volatile days. A trade without a stop-loss is not a trade — it is a gamble. Define your risk before entry, always.
Overtrading on choppy days: Not every day is a trending day. On days when Bank Nifty opens flat and oscillates in a 200-point range, experienced traders either step aside or scalp small. Beginners force trades and get chopped to pieces.
Ignoring the broader Nifty 50 trend: Bank Nifty rarely goes up when Nifty 50 is deeply falling. Check the Nifty 50 chart alongside Bank Nifty — if the broader market is weak, Bank Nifty longs are fighting an uphill battle.
Chasing options premium on expiry day: Gamma risk is extreme on expiry Thursdays. Options that look "cheap" at ₹5–10 can expire worthless 30 minutes later even if you got the direction right. Have a specific expiry-day strategy or avoid trading options on expiry morning.
Why experienced traders choose guided mentorship over self-learning
TradingView gives you the tools. But tools without a framework produce inconsistent results. The difference between a trader who loses money consistently and one who builds a process that works is rarely the indicators they use — it is the discipline, risk management, and pattern recognition that only comes from structured practice under experienced guidance.
At Amuktha, we have been mentoring traders since 2013 — across Bank Nifty, Nifty 50, and global indices including the Dow Jones and Nasdaq. Our approach combines:
Live market sessions where you watch analysis happen in real time on TradingView
Trade journaling and weekly review to identify your specific mistake patterns
Options strategy frameworks for both trending and sideways markets
A personalised study path whether you are a beginner, intermediate, or actively trading but not yet consistently profitable
Traders from Hyderabad, Chennai, Mumbai, Kerala, and increasingly from the Indian diaspora in the US, Canada, UK, and Australia have worked with our mentors to build a sustainable edge in Bank Nifty.
Start your Bank Nifty journey with Amuktha in 2026
If you have been trading Bank Nifty without a structured framework — or if you are just starting and want to avoid the expensive mistakes most beginners make — we are here to help.
Book a free consultation with our team →
We will understand where you are, what you are trading, and what kind of support will move the needle fastest for you.
FAQ (add these with FAQ schema markup)
Q: How do I add Bank Nifty to TradingView?
Search for NSE:BANKNIFTY in the TradingView search bar. Click the ticker to open the chart. Add it to your watchlist by clicking the star icon so you can access it instantly each session.
Q: Which timeframe is best for Bank Nifty intraday trading on TradingView?
The 15-minute chart is the most widely used timeframe among Bank Nifty intraday traders. Use the 1-hour chart for trend direction and the 5-minute chart only for precise entry timing after the setup is already confirmed on the 15-minute.
Q: Is TradingView free for Indian traders?
TradingView offers a free plan that allows basic charting with a limited number of indicators. For serious trading with multiple indicators, alerts, and saved chart templates, the Pro or Pro+ subscription is recommended.
Q: What indicators do professional Bank Nifty traders use?
The most effective combination is VWAP, 20-EMA, 50-EMA, RSI (14), and Supertrend (10,3). Avoid using more than 4–5 indicators simultaneously — chart clutter leads to analysis paralysis.
Q: How much capital do I need to start trading Bank Nifty options?
One Bank Nifty options lot currently requires approximately ₹15,000–₹25,000 in margin depending on the strike and expiry. However, capital alone is not the limiting factor — without a tested strategy and risk management, even large capital depletes quickly. We recommend starting with paper trading before going live.
Q: Can NRIs trade Bank Nifty from the US, UK, Canada, or Australia?
NRIs can trade Bank Nifty F&O through a registered NRO trading account linked to an Indian broker. Several brokers like Zerodha, ICICI Direct, and HDFC Securities offer NRI-specific accounts. Our mentorship at Amuktha serves the Indian diaspora globally and sessions are conducted online.
Disclaimer:- Trading in securities markets carries substantial risk and is not suitable for everyone. Past performance is not indicative of future results. This article is for educational purposes only and should not be construed as investment advice. Please conduct your own research and consult a SEBI-registered financial advisor before making trading or investment decisions.
© 2026 Amuktha Trading. Telangana, India. Serving global traders since 2013.