Bank Nifty Option Chain Analysis: Complete Guide for Traders in 2026
By Amuktha Trading Services | Hyderabad, India | Updated: April 2026 Trusted by traders across India, the US, UK, Canada, Australia, and the Indian diaspora worldwide since 2013.
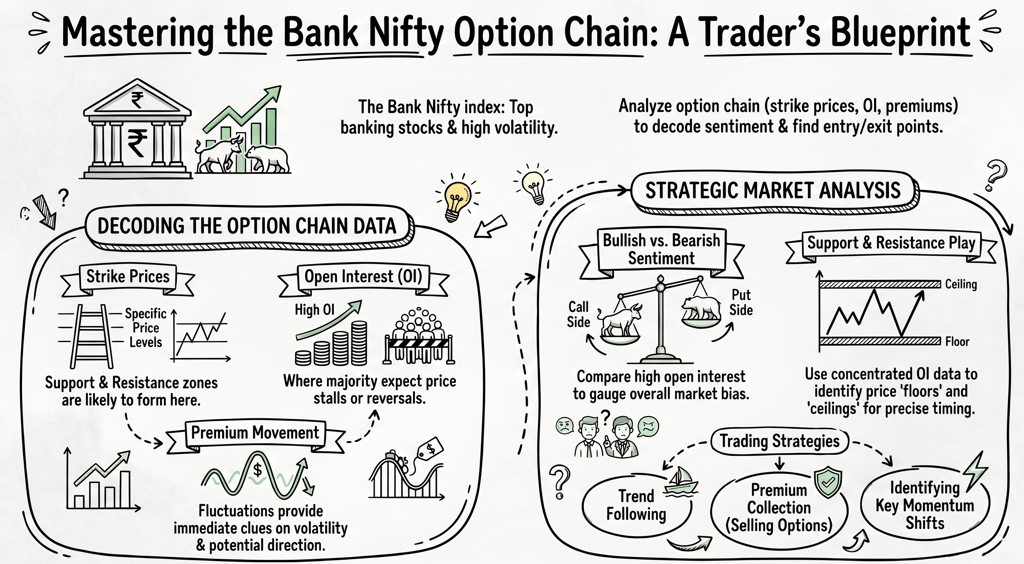
WHAT IS THE BANK NIFTY OPTION CHAIN?
The Bank Nifty option chain is a real-time data display that shows every available Call (CE) and Put (PE) contract for the Nifty Bank index across all strike prices and expiry dates. Think of it as the market's order book for India's most actively traded derivatives instrument — a live window into where real money is positioned, and why.
The Nifty Bank index, commonly known as BANKNIFTY or Bank Nifty, tracks 12 of India's largest and most liquid banking stocks including HDFC Bank, ICICI Bank, SBI, Axis Bank, and Kotak Mahindra Bank. Because Indian banks are deeply sensitive to RBI rate decisions, inflation data, FII flows, and global financial conditions, Bank Nifty is one of the most volatile and opportunity-rich indices on the NSE.
In 2026, Bank Nifty options remain the single most-traded derivatives product on NSE by volume. Millions of retail and institutional traders across India — and increasingly among the Indian diaspora in the US, UK, Canada, and Australia — use the Bank Nifty option chain every single trading session. Unlike a price chart alone, the option chain reveals where large traders are placing their money, their conviction levels, their hedges, and their expected price zones — often before price moves happen.
HOW TO READ THE BANK NIFTY OPTION CHAIN: STEP BY STEP
Whether you open the NSE India option chain, Sensibull, or your broker's terminal, the structure is always the same. The option chain is divided into three zones. On the left side you find all Call (CE) data — these represent bullish positions. In the centre sits the strike price column. On the right side you find all Put (PE) data — these represent bearish and hedging positions.
Strike prices run in ascending order, spaced 100 points apart for Bank Nifty. The ATM, or At-the-Money strike, is the one closest to the current Bank Nifty spot price. This is where maximum open interest typically concentrates and where most trading action happens. Strikes below ATM are In-the-Money for Calls and Out-of-the-Money for Puts. Strikes above ATM are Out-of-the-Money for Calls and In-the-Money for Puts.
The most important columns to understand are LTP, OI, Change in OI, Volume, IV, and Bid-Ask.
LTP stands for Last Traded Price. It is the most recent premium paid for that option contract — what you actually pay when you buy an option.
OI stands for Open Interest. This is the total number of outstanding contracts at that strike that have not yet been squared off. It is the single most important column in the entire option chain. High OI at a strike tells you that a large number of traders have taken positions there, making it a significant price level.
Change in OI is even more powerful than OI alone. It tells you whether new positions are being added — fresh conviction — or whether existing positions are being closed — unwinding. Always look at OI change alongside the direction of price to understand what the market is actually doing.
Volume is the number of contracts traded today. High volume confirms genuine participation. High OI without accompanying volume may not signal strong near-term conviction, as those positions may be from earlier sessions.
IV stands for Implied Volatility. It represents the market's collective expectation of how much Bank Nifty will move. Higher IV means higher premiums and more uncertainty expected. IV tends to spike ahead of major events like RBI monetary policy meetings, the Union Budget, election results, and US Federal Reserve announcements.
Bid and Ask show the best available buy and sell prices at that strike. A tight bid-ask spread means the option is liquid and easy to trade without paying excessive slippage.
A REAL WORKED EXAMPLE
Suppose Bank Nifty is trading at 55,000 on a Wednesday expiry day. You open the option chain and notice that the 55,200 CE has an open interest of 1,80,000 contracts that is rising by 40,000 in the last hour. Simultaneously, the 54,800 PE has an OI of 1,60,000 contracts, also rising. Bank Nifty price is hovering between 54,900 and 55,100 with no clear breakout in either direction.
What does this tell you? Large sellers are writing Calls at 55,200 and Puts at 54,800. They expect the index to expire within this range. This is a classic straddle zone — the expected range for the session. Unless an unexpected news event hits, buying options outside this range carries significant risk due to accelerating time decay on expiry day.
OPEN INTEREST: READING SMART MONEY SIGNALS
Open Interest is the heartbeat of the Bank Nifty option chain. The way you interpret it depends on combining OI changes with price direction.
When price is rising and OI is also rising, this signals a Long Build-up. Fresh buying is entering the market with bullish conviction. When price is falling and OI is rising, this signals a Short Build-up. Fresh selling is entering the market with bearish conviction. When price is rising but OI is falling, this signals Short Covering — shorts are exiting, and the rally may be temporary rather than driven by genuine bullish demand. When price is falling and OI is falling simultaneously, this signals Long Unwinding — longs are exiting, and the decline may also be temporary.
Always read these four combinations before deciding on a trade direction. They tell you the story behind the price move, not just the move itself.
The strike with the highest Put OI acts as strong support. Large Put writers have sold Puts at that level, betting Bank Nifty will not fall below it. If the index does approach that strike, these writers have a financial incentive to defend it. The strike with the highest Call OI acts as strong resistance. Call writers have sold Calls there, expecting the index to stay below that level. A price breakout above it with simultaneously rising Call OI is a confirmed breakout — not a false one.
A practical habit our mentors at Amuktha teach every student: at 9:30 AM IST every trading day, identify the top three Call OI strikes and the top three Put OI strikes. Plot these as horizontal lines on your TradingView chart. These become your intraday support and resistance levels — derived from real money positions, not arbitrary technical drawings.
MAX PAIN: WHERE OPTION SELLERS WANT PRICE TO LAND
Max Pain is the strike price at which the maximum number of option buyers would lose their entire premium at expiry. Because option sellers — typically institutions and experienced traders — benefit most when options expire worthless, there is a natural gravitational pull toward the max pain level as expiry approaches. On expiry days, especially low-volatility ones with no major news events scheduled, Bank Nifty has historically shown a tendency to settle near the max pain strike by 3:30 PM IST. Tracking max pain each Wednesday morning gives you one more data point for your expiry day framework.
PCR — THE PUT-CALL RATIO: READING MARKET SENTIMENT
The Put-Call Ratio is one of the most widely used sentiment tools derived from the option chain. It is calculated by dividing total Put OI by total Call OI. A PCR above 1.3 signals excessive bearishness in the market — traders have piled into Put options, reflecting fear or pessimism. From a contrarian perspective, this is where you start watching for Call buying opportunities once price confirms a reversal. A PCR between 0.9 and 1.2 reflects a balanced and neutral market. This environment is well-suited to range-bound strategies like straddles and iron condors. A PCR below 0.7 signals excessive bullishness — traders have crowded into Call options, reflecting overconfidence or euphoria. This is where you watch for Put buying opportunities on confirmation of any weakness.
The critical thing to understand about PCR is that it is a contrarian indicator, not a trend-following one. Extreme readings often precede reversals precisely because they reflect panic or overconfidence at a peak or trough. Never act on PCR alone — always wait for price action to confirm the reversal before entering a trade.
In early 2026, ahead of a key RBI policy decision, Bank Nifty's PCR dropped to 0.62, reflecting heavy Call buying and widespread bullish euphoria. Traders who used this as a contrarian signal — combined with an overbought RSI on the 15-minute chart and slowing upward momentum — positioned for a short-side correction. Bank Nifty corrected sharply the following session, rewarding those who read the option chain's warning rather than chasing the trend.
IMPLIED VOLATILITY AND EXPIRY DAY TACTICS
Implied Volatility, or IV, is the option chain's fear gauge. It represents what the market collectively expects about future price movement. When IV is high, option premiums are expensive. When IV is low, premiums are cheap.
For Bank Nifty in 2026, normal IV ranges between 12 and 18 percent. Elevated IV of 20 to 30 percent is common in the days before major events like RBI policy decisions, the Union Budget, or election results. IV above 30 percent is rare and usually signals a genuine market crisis.
The most common and costly trap for option buyers is called IV Crush. Before major events, IV rises sharply across all strikes, inflating every premium. Once the event passes — regardless of which direction Bank Nifty moves — IV collapses. This collapse erodes premium faster than the price move gains, leaving option buyers confused and at a loss even when their directional call was correct. At Amuktha, our mentors teach you to identify IV environments before entering trades, so you avoid paying inflated premiums. When IV is elevated, the smarter play is often a selling strategy that benefits from IV crush rather than a buying strategy that suffers from it.
On any expiry day, experienced traders use a simple technique called ATM straddle pricing to estimate the day's expected range. Add the ATM Call premium to the ATM Put premium at 9:15 AM IST. That sum is the market's implied expected move for the session in either direction. If the ATM 55,000 Call trades at 180 and the ATM 55,000 Put trades at 160, the expected range for the day is plus or minus 340 points — roughly 54,660 to 55,340. Trading directional options outside this range without a clear news catalyst is statistically unfavourable for buyers on expiry day.
OPTION GREEKS MADE SIMPLE FOR INDIAN TRADERS
The Option Greeks quantify how an option's price changes with different market conditions. For Bank Nifty traders, four Greeks matter most in day-to-day trading.
Delta measures how much the option price moves for every one-point move in Bank Nifty. ATM options carry a Delta of approximately 0.50, meaning they move 50 paise for every one rupee move in the index. Deep ITM options have Delta close to 1, moving almost in line with the index. OTM options have Delta close to 0, barely moving even with significant index moves.
Theta represents time decay — how much value the option loses per day, all else being equal. Theta is the biggest enemy of option buyers and the best friend of option sellers. On expiry day, Theta decay accelerates sharply in the final two hours of trading. An option that seemed reasonably priced at 11:00 AM can lose 60 to 80 percent of its remaining value by 3:00 PM purely because of Theta, without any adverse move in Bank Nifty.
Vega measures the option's sensitivity to IV changes. High-Vega options are significantly impacted by any rise or fall in implied volatility. Before events, Vega becomes your biggest risk if you are a buyer — because when IV collapses post-event, high Vega means high premium loss.
Gamma measures the rate of change of Delta. Near ATM strikes on expiry day, Gamma is at its highest. This means small Bank Nifty moves cause dramatic, non-linear P&L swings. This is exactly why expiry days are both the most profitable and the most dangerous sessions for options traders.
INTRADAY STRATEGIES USING THE BANK NIFTY OPTION CHAIN
These are the core strategies our mentors at Amuktha build around in the one-on-one mentorship program.
The first is OI-Based Support and Resistance Trading. At 9:30 AM, identify the strikes with the highest Call OI (resistance) and the highest Put OI (support), then plot them on your 15-minute chart. If Bank Nifty approaches the Put OI support level and a bullish confirmation candle forms — a hammer, bullish engulfing, or morning star — enter a Call option. Your exit target is the next Call OI resistance strike. Your stop loss triggers if price breaks below the Put OI support with rising OI, confirming that the support level is breaking, not holding.
The second strategy uses Change in OI for trend confirmation. Rising price alongside rising Call OI signals a strong uptrend — ride it. Rising price alongside falling OI signals short covering only — be cautious and plan an early exit. A sudden mid-session OI spike at a particular strike signals fresh institutional accumulation — follow the direction of that accumulation.
The third strategy is the PCR Reversal Setup, a contrarian approach. When PCR drops below 0.70 and Bank Nifty simultaneously shows bearish divergence on the RSI (14) on the 15-minute chart, with price trading below VWAP or VWAP sloping downward, consider entering Put options at a strike just below ATM. Target the next Put OI support break level as your exit.
The fourth strategy is Expiry Day Range Trading using ATM straddle analysis. Calculate the straddle price at market open to define the expected range. Selling straddles or strangles within the expected range is a viable income strategy for experienced traders — but it carries unlimited theoretical risk and must always be hedged with further OTM options as a spread. Buying options outside the straddle range should only be considered when you have a specific, high-conviction news catalyst.
The fifth strategy is Premium Collection at OI walls. Selling slightly OTM options at strikes with high OI and collecting premium works on the logic that high OI strikes represent price walls that institutions are defending. Combined with time decay working in the seller's favour, this strategy can generate consistent income — but always hedge with further OTM options to cap your maximum loss.
COMMON MISTAKES TRADERS MAKE WITH THE BANK NIFTY OPTION CHAIN
The first mistake is relying only on total OI and ignoring Change in OI. Total OI is historical. Change in OI is real-time. A strike with massive accumulated OI that is rapidly declining is losing relevance, not gaining it. Always look at both together.
The second mistake is trading on PCR or OI levels without price confirmation. The option chain shows expectation, not guarantee. Price can and does break through OI walls during major news events. Always wait for price to confirm the level before entering a position.
The third mistake is buying options on expiry day without understanding Theta. On Wednesday expiry days, ATM and near-ATM options can lose 50 to 80 percent of their remaining value in the final two hours purely due to time decay. Buying OTM options after 2:00 PM on expiry day is extremely high-risk without a clear, imminent catalyst.
The fourth mistake is ignoring IV before major events. Buying options when IV is already at 25 percent or above is buying expensive insurance. When the event resolves, IV collapses, and your P&L suffers even if you were right about direction.
The fifth mistake is not tracking FII index option data. FII positioning in index options — available via NSE's published FII derivative statistics — gives insight into what the largest participants in the market are doing. Our mentors at Amuktha teach a pre-market routine that incorporates FII data every morning before trading begins.
NRI AND GLOBAL TRADERS: TRADING BANK NIFTY FROM ABROAD
If you are part of the Indian diaspora in the US, Canada, UK, Europe, or Australia and interested in trading Bank Nifty options, here is what you need to know in 2026.
NRIs can legally trade F&O on NSE through an NRO (Non-Resident Ordinary) demat and trading account with a SEBI-registered broker. Repatriation of F&O profits is subject to RBI guidelines and the relevant tax treaty between India and your country of residence.
NSE market hours run from 9:15 AM to 3:30 PM IST. For traders in the US Eastern timezone, that corresponds to roughly 11:45 PM to 6:00 AM — the previous night into early morning. US West Coast traders are looking at 8:45 PM to 3:00 AM. UK-based traders in GMT or BST see the market open between 3:45 AM and 10:00 AM. For those in Australia on AEDT, the session runs 2:45 PM to 9:00 PM, which is actually the most convenient timezone for accessing Indian markets during normal waking hours.
Because of these time zone realities, many NRI traders prefer swing and positional strategies over intraday approaches, or they set bracket orders and price alerts before the session begins and let their framework execute without needing to watch the screen every minute.
F&O trading income is treated as business income in India, not capital gains. NRIs whose total Indian-sourced income exceeds the basic exemption limit must file an Indian income tax return. Always consult both a SEBI-registered financial advisor and a chartered accountant who is familiar with NRI taxation before trading.
Amuktha has been mentoring NRI traders from the US, UK, Canada, Australia, and the Gulf since 2013. All mentorship sessions are conducted online, making timezone differences manageable. We offer flexible scheduling designed specifically for NRI clients so that geography is never a barrier to learning.
FREQUENTLY ASKED QUESTIONS
What is the Bank Nifty option chain in simple terms?
It is a live display of all available Call and Put options for the Bank Nifty index across different strike prices. It shows you the price, volume, and number of open contracts at each level, helping you understand where traders are positioned and what price levels the market considers significant.
How do I access the Bank Nifty option chain?
The official and free source is the NSE India website at nseindia.com. You can also access it through your broker's trading platform — Zerodha, Upstox, Angel One, ICICI Direct, and others — or through dedicated analytics platforms like Sensibull or Opstra.
What is the lot size for Bank Nifty options in 2026?
The current lot size for BANKNIFTY options is 30 units per contract. This means one lot of an ATM Bank Nifty option priced at 200 rupees costs 6,000 rupees (200 multiplied by 30).
Which strike price should beginners focus on?
Beginners should focus on the ATM strike and the first one or two strikes on either side. These have the highest liquidity, tightest bid-ask spreads, and the most reliable OI data. Avoid deep OTM options — they look cheap but carry very low probability of profit and are highly sensitive to time decay.
When does Bank Nifty option expire in 2026?
Bank Nifty options have weekly expiry every Wednesday. The monthly expiry falls on the last Wednesday of each month. Quarterly and half-yearly expiry contracts are also available for positional traders who prefer longer timeframes.
What is max pain in the Bank Nifty option chain?
Max pain is the strike price at which the maximum number of option buyers would lose their entire premium at expiry. Option sellers benefit most when price settles at this level. Price tends to gravitate toward max pain as expiry approaches, particularly in calm, low-volatility sessions without major news events.
Is it safe for NRIs to trade Bank Nifty options?
NRIs can legally trade Bank Nifty options through an NRO account with a SEBI-registered broker. The risks are identical to those faced by resident traders — high volatility, leverage risk, and Theta decay. Professional mentorship is strongly recommended before committing real capital.
What is a good PCR level for Bank Nifty?
A PCR between 0.9 and 1.2 reflects a balanced market. Below 0.7 indicates excessive bullishness and potential reversal territory. Above 1.3 indicates excessive bearishness and a potential bounce zone. Always combine PCR readings with price action confirmation before entering any trade.
How is Bank Nifty different from Nifty 50 for options trading?
Bank Nifty is significantly more volatile than Nifty 50, with sharper and faster intraday moves. It reacts more aggressively to banking sector news, RBI decisions, and FII flows. This makes it more rewarding for skilled traders but more dangerous for the unprepared. Nifty 50 is broader and generally less volatile, making it better suited for conservative options strategies.
Can I trade Bank Nifty options with 50,000 rupees?
Yes, but capital management becomes critical at this account size. One lot of an ATM Bank Nifty Call or Put priced at 200 rupees costs 6,000 rupees. With 50,000 rupees, you could theoretically take several simultaneous positions, but losses compound quickly without strict risk management. At Amuktha, we teach position sizing frameworks specifically designed to protect smaller accounts while you build skill and confidence.
WHY LEARN BANK NIFTY OPTION CHAIN ANALYSIS WITH AMUKTHA?
Reading the Bank Nifty option chain is a skill — not a talent you are born with and not something you can master by watching a few YouTube videos. It takes time, practice, and above all, a structured framework that helps you avoid the expensive mistakes most self-taught traders make in their first one to two years of trading.
Since 2013, Amuktha Trading Services has helped hundreds of traders across Hyderabad, Chennai, Mumbai, and Kerala — and the Indian diaspora in the US, Canada, UK, and Australia — build a disciplined, data-driven approach to Bank Nifty trading. Our students are not chasing tips or copying trades. They are learning to read the market themselves.
Our mentorship is not a pre-recorded video course you watch at midnight and forget by morning. It is live, one-on-one coaching with experienced traders who read the option chain every single trading day and teach you to do the same within the context of your own schedule, goals, and risk tolerance.
The program covers your complete pre-market routine using the option chain, OI reading and PCR interpretation frameworks, intraday strategy setup from 9:15 AM to 3:30 PM, expiry day trading playbooks, risk management and position sizing rules, and ongoing support through dedicated communication channels.
Whether you are a complete beginner trying to understand what open interest means, an intermediate trader who has been in the markets for a year but cannot find consistency, or an NRI looking to participate in Indian markets from abroad with a structured approach — we design the mentorship around where you are right now, not a generic syllabus built for someone else.
Ready to read the Bank Nifty option chain like an expert?
Book a Free Consultation: amuktha.com/contact-us View Mentorship Programs: amuktha.com/trading-mentor
Disclaimer:- Trading in securities markets carries substantial risk and is not suitable for everyone. Past performance is not indicative of future results. This article is for educational purposes only and should not be construed as investment advice. Please conduct your own research and consult a SEBI-registered financial advisor before making trading or investment decisions.
© 2026 Amuktha Trading. Telangana, India. Serving global traders since 2013.