
Nifty 50 Today: Complete Trading & Investment Guide for 2026
Last Updated: January 27, 2026
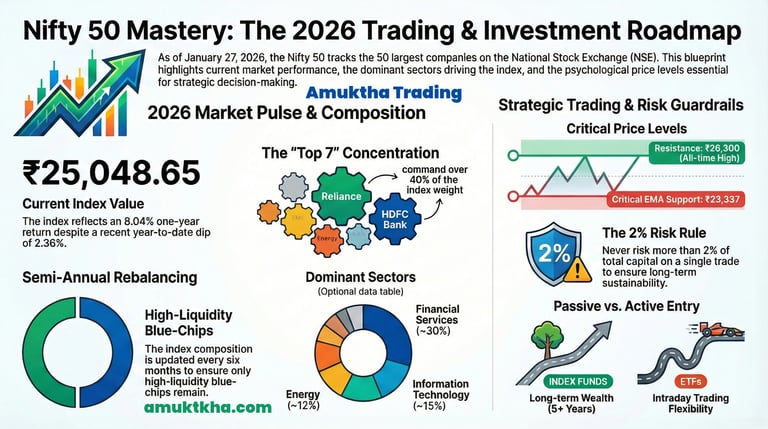
The Nifty 50 stands as India's premier stock market benchmark, tracking the 50 largest and most liquid companies on the National Stock Exchange (NSE). As of January 27, 2026, the Nifty 50 is trading at approximately ₹25,048.65, representing the collective performance of India's blue-chip corporations across diverse sectors.
Whether you're a retail trader analyzing Nifty options, an investor building long-term wealth through Nifty ETFs, or a day trader executing Nifty futures strategies, understanding this index is fundamental to your success in the Indian equity markets.
What is the Nifty 50 Index? Understanding India's Market Barometer
The Nifty 50 index is more than just a number—it's a comprehensive snapshot of India's economic health. Launched on April 22, 1996, with a base value of 1,000, this index has evolved into the most widely tracked benchmark in Indian capital markets.
Key Characteristics of Nifty 50
Index Composition: 50 carefully selected large-cap stocks representing 13 major economic sectors
Calculation Method: Free-float market capitalization weighted methodology
Base Date: November 3, 1995
Current Market Cap: Approximately ₹199.81 trillion (as of January 2026)
Rebalancing Frequency: Semi-annually (based on data ending January 31 and July 31)
Index Manager: NSE Indices Limited, a wholly-owned subsidiary of NSE
How Nifty 50 is Calculated
The Nifty 50 index value is calculated using the formula:
Index Value = Current Market Value / (Base Market Capital × Base Index Value)
This calculation incorporates corporate actions such as stock splits, bonus issues, rights offerings, mergers, and de-listings to ensure continuity and accuracy. The free-float methodology means only shares available for public trading are counted, excluding shares held by promoters, government entities, or strategic investors.
Current Nifty 50 Market Overview (January 2026)
Real-Time Market Data
Current Price: ₹25,048.65 (as of January 27, 2026)
52-Week High: ₹26,373.20 (reached January 5, 2026)
52-Week Low: ₹21,743.65
Year-to-Date Performance: Down approximately 2.36%
1-Year Return: Up 8.04%
Volatility (Nifty VIX): Moderate levels indicating investor caution
Top Weighted Constituents (January 2026)
1. Reliance Industries (Energy & Retail)
Weight: 9.33% | Current Price: ₹1,386.10
2. HDFC Bank (Banking)
Weight: 6.96% | Current Price: ₹916.10
3. Bharti Airtel (Telecom)
Weight: 6.00% | Current Price: ₹1,984.70
4. Tata Consultancy Services (TCS) (IT Services)
Weight: 5.61% | Current Price: ₹3,162.50
5. ICICI Bank (Banking)
Weight: 4.74% | Current Price: ₹1,343.40
6. State Bank of India (Banking)
Weight: 4.76% | Current Price: ₹1,029.50
7. Infosys (IT Services)
Weight: 3.32% | Current Price: ₹1,670.80
These top 7 companies alone represent over 40% of the Nifty 50's total weight, highlighting the index's concentration in financial services and technology sectors.
Sector-Wise Breakdown
The Nifty 50's diversification across sectors provides balanced exposure to the Indian economy:
Financial Services: ~30% (Banking, NBFCs, Insurance)
Information Technology: ~15% (Software, IT Services)
Energy: ~12% (Oil & Gas, Power)
Consumer Goods: ~10% (FMCG, Auto)
Pharmaceuticals: ~5%
Metals & Mining: ~4%
Others: ~24% (Telecom, Cement, Real Estate, etc.)
Understanding Related Nifty Indices for Strategic Trading
1. Nifty Next 50: Growth Beyond Blue Chips
The Nifty Next 50 represents the next tier of large-cap companies by market capitalization, immediately following the Nifty 50 constituents. This index offers:
Exposure to emerging blue-chip companies
Higher growth potential compared to established Nifty 50 stocks
Diversification beyond the top 50 companies
Includes companies like LIC, DMart, Adani Green Energy, Siemens
Investment Strategy: Many savvy investors combine Nifty 50 and Nifty Next 50 ETFs in a 70:30 or 60:40 ratio for optimal risk-adjusted returns.
2. Nifty Bank Index: Banking Sector Focus
The Nifty Bank index comprises 12 of the most liquid and large banking stocks, making it essential for traders focused on the financial sector. Currently trading around ₹60,146.60, it includes:
HDFC Bank, ICICI Bank, State Bank of India (largest weights)
Axis Bank, Kotak Mahindra Bank, IndusInd Bank
Private and public sector banks
Trading Insight: Nifty Bank futures and options are among the most actively traded derivatives in India, offering high liquidity and significant intraday volatility.
3. Sector-Specific Nifty Indices for Tactical Trading
Nifty Auto Index
Tracks 15 automobile and auto component companies. Key constituents include Maruti Suzuki (₹15,469), Mahindra & Mahindra, Tata Motors, and Bajaj Auto (₹9,413.50).
Nifty IT Index
Represents the information technology sector with companies like TCS, Infosys, HCL Technologies, Wipro, and Tech Mahindra. This index is particularly sensitive to global economic conditions and USD-INR exchange rates.
Nifty Pharma Index
Focuses on pharmaceutical companies including Sun Pharma (₹1,631.90), Dr. Reddy's, Cipla, and Divi's Laboratories. This sector provides defensive characteristics during market downturns.
Nifty Metal Index
Covers metal and mining stocks such as JSW Steel (₹1,170), Tata Steel, Hindalco, and Coal India (₹418.40). Highly cyclical and sensitive to global commodity prices.
4. Broader Market Indices
Nifty 100
Represents the top 100 companies by market capitalization, providing broader market coverage while maintaining focus on large-caps.
Nifty Midcap 150
Tracks 150 mid-cap companies, offering exposure to businesses with higher growth potential and moderate risk.
Nifty Smallcap 250
Covers 250 small-cap stocks for investors seeking maximum growth potential with higher volatility.
How to Trade Nifty Options: Advanced Strategies for 2026
Understanding the Nifty 50 Option Chain
The Nifty option chain is a comprehensive table displaying all available call and put options at various strike prices. Mastering option chain analysis is crucial for successful derivatives trading.
Key Metrics in Option Chain Analysis
1. Open Interest (OI)
Represents the total number of outstanding option contracts
High OI at specific strike prices indicates strong support or resistance levels
Rising OI with rising price = bullish sentiment (new long positions)
Rising OI with falling price = bearish sentiment (new short positions)
2. Implied Volatility (IV)
Measures expected price movement as implied by option premiums
High IV = expensive options, expect significant price movement
Low IV = cheaper options, expect range-bound movement
Compare with historical volatility for trading opportunities
3. Put-Call Ratio (PCR)
Calculated as: Put OI / Call OI
PCR > 1.2 = bullish sentiment (more puts, potential support)
PCR < 0.8 = bearish sentiment (more calls, potential resistance)
PCR around 1.0 = neutral market
4. Max Pain Theory
The strike price where option buyers lose maximum value at expiry
Index tends to gravitate toward max pain on expiry days
Useful for predicting potential expiry settlement levels
Proven Nifty Options Trading Strategies
Strategy 1: Long Call (Bullish Directional)
When to Use: Expecting significant upward movement
Execution:
Buy ATM or slightly OTM call option
Limited risk (premium paid), unlimited profit potential
Best during low IV periods
Example: Nifty at 25,050, buy 25,100 CE at ₹80. Profit if Nifty closes above 25,180.
Strategy 2: Bull Call Spread (Limited Risk Bullish)
When to Use: Moderately bullish, want to reduce premium cost
Execution:
Buy ATM call, sell OTM call at higher strike
Lower cost than naked call, limited profit potential
Reduces impact of time decay
Example: Buy 25,100 CE at ₹80, sell 25,300 CE at ₹30. Net cost: ₹50. Max profit: ₹150.
Strategy 3: Iron Condor (Range-Bound Market)
When to Use: Expecting minimal movement, high IV environment
Execution:
Sell OTM call and put, buy further OTM call and put for protection
Profit from time decay if market stays within range
Limited risk and reward
Example: Sell 25,300 CE, sell 24,800 PE, buy 25,500 CE, buy 24,600 PE. Collect net premium, profit if Nifty stays between 24,800-25,300.
Strategy 4: Straddle (High Volatility Expected)
When to Use: Before major events (Budget, RBI policy, elections)
Execution:
Buy ATM call and ATM put simultaneously
Profit from large moves in either direction
High cost, needs significant movement
Strategy 5: Covered Call (Income Generation)
When to Use: Own Nifty ETF, want additional income
Execution:
Hold Nifty ETF/futures, sell OTM call options
Collect premium income, caps upside
Reduces portfolio volatility
Weekly vs. Monthly Nifty Options: Choosing the Right Expiry
Weekly Options (Expire every Thursday):
Higher theta decay (time value erosion)
Lower premiums, affordable for retail traders
Ideal for short-term directional trades
Higher leverage, higher risk
Monthly Options (Expire last Thursday):
More time to be right, lower theta decay
Higher premiums, higher capital requirement
Suitable for swing trading and positional strategies
Better for complex multi-leg strategies
Nifty Futures Trading: Comprehensive Guide
Understanding Nifty Futures Contracts
Nifty futures are standardized contracts to buy or sell the Nifty 50 index at a predetermined price on a specified future date. Key specifications:
Lot Size: 25 units (as of 2026, subject to change based on index value)
Contract Value: Nifty Price × Lot Size (e.g., 25,050 × 25 = ₹6,26,250)
Margin Requirement: Typically 10-15% of contract value (SPAN + Exposure)
Expiry: Last Thursday of every month
Settlement: Cash settlement based on closing index value
Trading Hours: 9:15 AM to 3:30 PM IST
Advanced Nifty Futures Trading Strategies
1. Trend Following Strategy
Use technical indicators to identify and ride trends:
Entry Signals: Price above 50 EMA + RSI > 50 + increasing volume
Exit Signals: Price crosses below 20 EMA or trailing stop-loss hit
Risk Management: 1-2% of capital per trade, stop-loss below recent swing low
2. Mean Reversion Trading
Exploit overbought/oversold conditions:
Entry: RSI < 30 (oversold) or RSI > 70 (overbought)
Confirmation: Candlestick reversal patterns (hammer, shooting star, engulfing)
Target: Mean (20-period moving average)
3. Breakout Trading
Capitalize on price breaking key resistance/support:
Identification: Consolidation ranges, triangle patterns, channels
Entry: Break above resistance with 15-min candle close + volume spike
Stop-Loss: Below breakout level
Target: Measured move (range height added to breakout)
4. Spread Trading (Calendar Spread)
Exploit price differences between near and far month contracts:
Execution: Sell current month, buy next month futures
Profit From: Time decay differential and roll-over premium
Lower Risk: Hedged position, lower margin requirement
Reading Nifty Futures Charts Like a Pro
Essential Chart Patterns
1. Candlestick Patterns
Doji: Indecision, potential reversal
Hammer/Shooting Star: Reversal signals at support/resistance
Engulfing Patterns: Strong reversal indicators
Morning/Evening Star: Three-candle reversal formations
2. Chart Formations
Head and Shoulders: Bearish reversal pattern
Inverse Head and Shoulders: Bullish reversal
Double Top/Bottom: Reversal after failed breakout attempts
Ascending/Descending Triangles: Continuation patterns
Flags and Pennants: Short-term consolidation before trend continuation
Key Technical Indicators
1. Moving Averages
20 EMA: Short-term trend, dynamic support/resistance
50 EMA: Medium-term trend indicator
200 EMA: Long-term trend, major support/resistance (currently critical level)
Golden Cross: 50 EMA crosses above 200 EMA (bullish)
Death Cross: 50 EMA crosses below 200 EMA (bearish)
2. Momentum Indicators
RSI (Relative Strength Index): > 70 overbought, < 30 oversold
MACD: Trend following and momentum indicator
Stochastic Oscillator: Identifies overbought/oversold conditions
3. Volume Indicators
Volume Profile: Shows price levels with highest trading activity
OBV (On-Balance Volume): Confirms trends with volume analysis
VWAP (Volume Weighted Average Price): Intraday benchmark for institutional trades
Critical Support and Resistance Levels (January 2026)
Immediate Trading Levels
Strong Resistance: ₹26,300
Significance: All-time high zone, psychological barrier that represents the peak level reached by the index. Breaking above this level would signal strong bullish momentum and potential for new highs.
Immediate Resistance: ₹25,730
Significance: Recent swing high, call writing zone where traders typically sell call options. This level acts as a near-term ceiling for price movement.
Current Price: ₹25,048
Significance: Trading range, decision zone where the market is currently positioned. This is the battleground between bulls and bears.
Immediate Support: ₹24,400-24,100
Significance: Recent consolidation zone where the index has found support multiple times. This range represents strong buying interest.
Critical Support: ₹23,337
Significance: 200-day Exponential Moving Average (EMA), major psychological level. A break below this would signal potential trend reversal and trigger significant selling.
Strong Support: ₹22,000
Significance: Previous breakout level that acted as resistance earlier and now serves as a major support base. This is a last-line defense for bulls.
Fibonacci Retracement Levels
From 52-week low (21,743) to 52-week high (26,373):
23.6% Retracement: 25,280
38.2% Retracement: 24,604
50.0% Retracement: 24,058
61.8% Retracement: 23,512
Best Tools and Resources for Nifty Trading in 2026
1. Live Market Data Platforms
NSE Website (Official)
Real-time index values and constituent data
Official announcements and circulars
Historical data downloads
Free option chain data
URL: www.nseindia.com
TradingView (Advanced Charting)
Professional-grade charting tools
100+ technical indicators
Community ideas and scripts
Multi-timeframe analysis
Custom alerts and notifications
Groww, Dhan, 5paisa (Broker Platforms)
Integrated trading and analysis
Real-time quotes and charts
One-click order execution
Portfolio tracking and P&L analysis
2. Analytical Tools
Nifty Heatmap Live
Visual representation of index constituent performance:
Color-coded based on percentage change
Sized by market capitalization
Quick identification of sector rotation
Spot individual stock movers impacting index
Nifty VIX (Volatility Index)
Measures expected volatility over the next 30 days:
VIX < 12: Low volatility, complacent market
VIX 12-20: Normal volatility, stable conditions
VIX > 20: High volatility, fearful market
Trading Insight: Sell options when VIX is high, buy when VIX is low
Open Interest Analysis Tools
Track buildup of positions (long/short)
Identify support/resistance from OI concentration
Monitor changes in OI throughout the day
Predict potential expiry levels
3. Investment Products
Nifty 50 Index Funds
Passive investment vehicles that replicate Nifty 50:
UTI Nifty 50 Index Fund: Low expense ratio, high AUM
ICICI Prudential Nifty 50 Index Fund: Consistent tracking error
SBI Nifty Index Fund: Low cost, reliable performance
Advantage: No stock selection required, low fees, tax efficient
Nifty 50 ETFs (Exchange Traded Funds)
Nifty BeES (Benchmark ETF): Most liquid, tight bid-ask spreads
ICICI Prudential Nifty ETF: High trading volume
Mirae Asset Nifty 50 ETF: Low tracking error
Bandhan Nifty 50 ETF: Competitive expense ratio
Advantage: Intraday trading, lower expense ratios than index funds
Nifty Next 50 ETFs
Exposure to next tier of large-caps
Higher growth potential
Diversification beyond top 50
How to Invest in Nifty 50: Multiple Approaches
Method 1: Direct Stock Investment (Replication)
Approach: Buy all 50 stocks in the same proportion as the index
Advantages:
Complete control over portfolio
Collect dividends directly
Tax harvesting opportunities
No fund management fees
Disadvantages:
High capital requirement (₹5-10 lakhs minimum)
Rebalancing complexity
Higher transaction costs
Time-consuming portfolio management
Method 2: Index Mutual Funds (Recommended for Most Investors)
Approach: Invest in Nifty 50 index funds via SIP or lumpsum
Advantages:
Low minimum investment (₹500 via SIP)
Automatic rebalancing
Professional management
Systematic investment option
Ideal For:
Long-term wealth creation (5+ years)
Retirement planning
First-time investors
Core portfolio allocation
Method 3: ETFs (Best for Active Traders)
Approach: Buy Nifty ETFs through demat account
Advantages:
Intraday trading capability
Lower expense ratios (0.05-0.15%)
Real-time pricing
Can be used as collateral
Ideal For:
Tactical allocation
Short to medium-term investing
Active portfolio rebalancing
Method 4: Derivatives (For Sophisticated Traders)
Approach: Trade Nifty futures and options
Advantages:
Leverage (control large positions with small capital)
Hedging existing portfolios
Profit from both directions
High liquidity
Risks:
High leverage can magnify losses
Requires active monitoring
Mark-to-market losses
Time decay in options
Nifty Trading Psychology and Risk Management
Essential Risk Management Rules
1. Position Sizing
Never risk more than 2% of capital per trade
Example: ₹10 lakh capital → max risk per trade = ₹20,000
Adjust lot size based on stop-loss distance
Consider correlation when holding multiple positions
2. Stop-Loss Discipline
Always use stop-losses, no exceptions
Place stops below technical levels (support, trendlines)
Avoid round numbers (use 24,947 instead of 25,000)
Trail stops to lock in profits
Never move stops against your position
3. Risk-Reward Ratio
Minimum 1:2 risk-reward ratio
If risking ₹100, target should be ₹200+
Allows 50% win rate to be profitable
Better ratios (1:3, 1:4) increase long-term profitability
4. Diversification
Don't put all capital in one trade
Limit sector concentration
Balance derivatives with cash investments
Consider correlation between positions
Common Trading Mistakes to Avoid
Overtrading: Taking too many positions reduces focus and increases costs
Revenge Trading: Trying to immediately recover losses leads to bigger losses
Ignoring Risk Management: One big loss can wipe out months of gains
Following Tips Blindly: Always do your own analysis
Trading Without a Plan: Every trade needs predefined entry, exit, and stop-loss
Emotional Decision Making: Fear and greed destroy accounts
Averaging Down Losses: Adding to losing positions magnifies risk
Neglecting Transaction Costs: Brokerage, taxes, and slippage eat into profits
Macroeconomic Factors Affecting Nifty 50 in 2026
Domestic Factors
1. Monetary Policy (RBI Actions)
Interest Rates: Current repo rate impacts liquidity and borrowing costs
Inflation Targeting: CPI above 6% prompts rate hikes, bearish for equities
Policy Announcements: Bi-monthly MPC meetings create volatility
Liquidity Management: CRR/SLR changes affect banking sector
2. Government Policy and Budget
Union Budget 2026: Expected February 1, 2026 (major event)
Fiscal Deficit Targets: Impact on government spending and market sentiment
Tax Policy: Changes in capital gains tax, STT affect trading costs
Sectoral Incentives: PLI schemes, subsidies boost specific sectors
3. Corporate Earnings
Quarterly Results: Earnings season drives stock-specific movements
Earnings Growth: Overall Nifty EPS growth indicates economic health
Margin Trends: Operating leverage and cost management
Forward Guidance: Management commentary on future outlook
4. FII/DII Activity
Foreign Institutional Investors: Net buying/selling indicates global sentiment
Domestic Institutional Investors: Mutual funds, insurance companies provide stability
Retail Participation: Growing retail investor base changes market dynamics
Global Factors
1. US Federal Reserve Policy
Interest rate decisions affect global liquidity flows
Higher US rates → capital outflow from emerging markets
Dollar strength impacts Indian exports and imports
2. Crude Oil Prices
India imports ~85% of oil requirements
Higher crude → higher inflation, wider current account deficit
Impacts energy, airline, paint, tire sectors
3. Geopolitical Events
Global conflicts affect commodity prices and risk sentiment
Trade agreements and tariffs impact export-oriented sectors
Regional tensions create safe-haven flows
4. Global Market Trends
S&P 500: Strong correlation with Nifty (0.6-0.7)
Asian Markets: Nikkei, Hang Seng influence intraday moves
GIFT Nifty: Pre-market indicator (traded in GIFT City)
Nifty 50 Selection Criteria: How Stocks Enter and Exit
Eligibility Criteria for Inclusion
Listing Requirement: Minimum 6-month listing history on NSE
Liquidity Test:
Must trade 90% of days in past 6 months
Average impact cost ≤ 0.50% for ₹10 crore basket size
Universe: Must be part of Nifty 100 (top 100 stocks by market cap)
Free-Float Requirement: At least 1.5x market cap of smallest current constituent
F&O Eligibility: Stock must be available for futures and options trading
Corporate Governance: No major regulatory issues or suspensions
Rebalancing Process
Frequency: Semi-annual (every 6 months)
Review Period: Data from January 1-31 and July 1-31
Announcement: ~4 weeks before implementation
Implementation: Last trading day of March and September
Transition: Gradual over final week to minimize market impact
Recent Changes and Potential Candidates
While the specific constituent changes for 2026 are determined by NSE, potential candidates from Nifty Next 50 include high-performing companies with growing market caps that meet all eligibility criteria.
Tax Implications for Nifty Trading and Investing (2026)
Equity Delivery (Long-Term Investment)
Short-Term Capital Gains (< 12 months): 20% tax
Long-Term Capital Gains (> 12 months): 12.5% on gains above ₹1.25 lakh per year
Dividend Income: Taxed at slab rates (no dividend distribution tax)
Intraday & F&O Trading (Speculative Income)
Tax Rate: As per individual income tax slab (up to 30% + 4% cess)
Set-Off: Speculative losses can only be set off against speculative gains
Carry Forward: Losses can be carried forward for 4 years
Turnover Requirement: Audit mandatory if turnover exceeds ₹10 crore
Securities Transaction Tax (STT)
Equity Delivery: 0.1% on both buy and sell
Equity Intraday: 0.025% on sell side
Futures: 0.0125% on sell side
Options (Buy): 0.0625% on premium
Options (Sell): 0.0625% on premium + 0.125% on settlement
Tax-Saving Strategies
Tax-Loss Harvesting: Offset gains with losses before year-end
LTCG Optimization: Hold positions beyond 12 months when possible
Index Funds: Lower portfolio turnover = lower tax impact
Professional Advice: Consult CA for complex trading situations
Frequently Asked Questions (FAQs)
1. Can I buy Nifty 50 directly?
No, you cannot buy the Nifty 50 index directly as it's just a calculated value. However, you can gain exposure through Nifty ETFs, index funds, futures contracts, or by buying all 50 constituent stocks in proportion.
2. What is the minimum investment to trade Nifty futures?
With Nifty at ₹25,050 and lot size of 25, contract value is ₹6,26,250. You need approximately ₹75,000-90,000 as margin (12-15% of contract value), though this varies by broker and market volatility.
3. How does Nifty VIX affect option premiums?
Nifty VIX measures expected volatility. Higher VIX means higher option premiums (both calls and puts become more expensive). VIX typically spikes during market corrections and major events, offering opportunities to sell options at premium prices.
4. What time should I trade Nifty options for best results?
Most active periods: 9:15-10:00 AM (opening volatility), 12:00-1:00 PM (mid-day consolidation), and 3:00-3:30 PM (closing volatility). Thursday expiry weeks see maximum action in final 30 minutes. Avoid trading during first 15 minutes unless you have specific strategy.
5. How do I choose between Nifty and Bank Nifty for trading?
Nifty 50 offers broader market exposure with moderate volatility, suitable for beginners and medium capital. Bank Nifty has higher volatility, larger moves, and higher margins—better for experienced traders with higher risk appetite. Bank Nifty lot size is also smaller, requiring less capital.
6. What is the difference between GIFT Nifty and regular Nifty?
GIFT Nifty trades at NSE International Exchange (GIFT City) and is available from 6:30 AM to 3:40 AM IST (almost 24 hours). Regular Nifty trades 9:15 AM to 3:30 PM. GIFT Nifty serves as a pre-market indicator for the Indian market opening.
7. Should I invest in Nifty 50 or Nifty Next 50?
Nifty 50 provides stability with blue-chip companies (lower risk, moderate returns). Nifty Next 50 offers higher growth potential but with increased volatility. A balanced approach: 70% Nifty 50 + 30% Nifty Next 50 provides optimal risk-adjusted returns for most investors.
8. How often does Nifty 50 composition change?
Nifty 50 is reviewed semi-annually (every 6 months). Changes are announced ~4 weeks before implementation and take effect on the last trading day of March and September. However, not every review results in changes—only when eligibility criteria warrant.
9. What causes Nifty to gap up or gap down at opening?
Gaps occur due to overnight global market movements (US markets, Asian markets), corporate announcements after market hours, geopolitical events, policy decisions, and GIFT Nifty movements. Check GIFT Nifty before market open to anticipate gaps.
10. Is Nifty trading better than individual stock trading?
Nifty advantages: Lower risk (diversified), predictable (technical analysis works better), high liquidity, no company-specific risk. Individual stocks: Higher return potential, dividend income, ability to pick winners. For derivatives trading, Nifty is often safer; for long-term investing, quality individual stocks may outperform.
Expert Resources and Learning Path
Recommended Learning Sequence
Beginner Level (Months 1-3)
Understand index basics and how Nifty is calculated
Learn to read charts and identify basic patterns
Start with Nifty ETF/index fund investments
Paper trade futures for practice
Study market hours, settlement process, and terminology
Intermediate Level (Months 4-8)
Master technical analysis indicators
Understand option Greeks (Delta, Gamma, Theta, Vega)
Practice option strategies on paper
Start small live trades with strict risk management
Develop a written trading plan
Advanced Level (Months 9+)
Implement multi-leg option strategies
Combine technical and fundamental analysis
Build automated trading systems
Optimize for tax efficiency
Scale position sizes gradually
Essential Reading and Resources
NSE India Website: Official data, circulars, and educational content
SEBI Investor Education: Free courses on derivatives and risk management
Books: "Option Volatility and Pricing" by Sheldon Natenberg, "Technical Analysis of the Financial Markets" by John Murphy
NSE Certification: NCFM certifications in derivatives add credibility
Why Choose Amuktha for Your Nifty Trading Journey?
At Amuktha Trading Services, we specialize in empowering traders and investors with comprehensive Nifty 50 expertise:
Our Offerings
Structured Trading Courses: From basics to advanced strategies
Live Market Analysis: Daily Nifty predictions and level-based trading
Personalized Mentorship: One-on-one guidance tailored to your goals
Risk Management Training: Protect your capital while maximizing returns
Community Support: Connect with fellow traders and share insights
Practical Approach: Real-world trading strategies that work in Indian markets
Get Started Today
Whether you're looking to trade Nifty options for income, invest in Nifty ETFs for wealth creation, or master Nifty futures for active trading, our expert team is here to guide you every step of the way.
Final Thoughts: Your Nifty 50 Success Roadmap
Success in Nifty 50 trading and investing requires three pillars:
Knowledge: Understand market mechanics, technical analysis, and derivatives
Discipline: Follow your trading plan, manage risk, and control emotions
Consistency: Small, regular gains compound over time
The Nifty 50, trading at ₹25,048.65 as of January 27, 2026, represents not just an index but the collective heartbeat of India's economic growth story. Whether you choose passive investing through ETFs or active trading through options and futures, maintaining a systematic approach with proper risk management will be your key to long-term success.
Remember: The market rewards patience, punishes greed, and always provides new opportunities for those who are prepared.
Stay Updated: Nifty 50 Today
For the latest Nifty 50 analysis, trading strategies, and market insights:
Bookmark this page and check daily updates
Follow official NSE announcements
Join our trading community for real-time discussions
Subscribe to our newsletter for weekly market analysis
Market Timings: Monday to Friday, 9:15 AM to 3:30 PM IST
Pre-Market Session: 9:00 AM to 9:15 AM IST
Post-Market Session: 3:40 PM to 4:00 PM IST
Disclaimer:- Trading in securities markets carries substantial risk and is not suitable for everyone. Past performance is not indicative of future results. This article is for educational purposes only and should not be construed as investment advice. Please conduct your own research and consult a SEBI-registered financial advisor before making trading or investment decisions.
© 2026 Amuktha Trading. Telangana, India. Serving global traders since 2013.