Nifty 50 Options Trading Guide 2026: Master Index Options for Consistent Profits
Master Nifty 50 options trading with our complete guide. Learn option chain analysis, proven strategies, risk management & how to profit consistently. Free calculator included!
Why Trade Nifty 50 Options? (And Why Most Traders Get It Wrong)
If you're exploring Nifty 50 options trading, you're looking at India's most liquid derivatives market. The Nifty 50 index options offer tremendous opportunities for income generation, hedging, and speculation—but here's the truth: 85% of retail option buyers lose money.
Not because options are inherently risky, but because traders:
Don't understand option chain data
Trade without a clear strategy
Ignore time decay and volatility
Risk too much capital on single trades
Buy options on expiry day without proper analysis
This guide changes that.
You'll learn exactly how professional traders approach Nifty 50 options—from understanding the option chain to implementing profitable strategies with proper risk controls.
What Are Nifty 50 Options? Complete Basics Explained
Understanding the Fundamentals
A Nifty 50 option is a derivative contract based on the Nifty 50 index (India's benchmark stock market index representing 50 largest companies by market capitalization).
When you trade Nifty options, you're NOT buying individual stocks. You're trading a contract based on the index level.
Two Types of Options
Call Options
Give you the RIGHT (not obligation) to BUY the index at a specific price
Profit when Nifty goes UP
Example: If Nifty is at 22,000 and you buy a 22,500 Call, you profit if Nifty rises above 22,500 + premium paid
Put Options
Give you the RIGHT (not obligation) to SELL the index at a specific price
Profit when Nifty goes DOWN
Example: If Nifty is at 22,000 and you buy a 21,500 Put, you profit if Nifty falls below 21,500 - premium paid
Key Terminology You Must Know
Strike Price - The price at which you can buy/sell the index Premium - The cost you pay to buy an option Expiry Date - When the option contract expires (weekly or monthly) Lot Size - Number of units per contract (currently 25 for Nifty, subject to change) In-the-Money (ITM) - Option with intrinsic value At-the-Money (ATM) - Strike price closest to current index level Out-of-the-Money (OTM) - Option with no intrinsic value, only time value
Understanding Nifty 50 Contract Specifications (2026)
Before you place your first trade, understand these critical specifications:
Current Contract Details
Specification Details Underlying Index Nifty 50 (NSE) Contract Size (Lot Size) 25 units (verify current lot size as it changes) Tick Size ₹0.05 Trading Hours 9:15 AM - 3:30 PM IST Expiry Day Every Thursday (weekly), Last Thursday of month (monthly) Settlement Cash-settled (no physical delivery) Contract Months Current month + 2 additional months + 3 serial monthly contracts
Calculating Your Position Value
Formula: Premium × Lot Size = Investment Required (for buying)
Example:
Nifty 22,000 Call premium: ₹150
Lot size: 25
Total investment: ₹150 × 25 = ₹3,750 (plus brokerage)
Important: For option selling, you need margin (much higher than buying cost).
Position Limits & Freeze Quantity
Market-wide Position Limit: Typically set by exchanges
Freeze Quantity: Orders above this quantity get frozen (to prevent manipulation)
Always check current limits on exchange website before placing large orders
Mastering the Nifty 50 Option Chain: Your Most Powerful Tool
The option chain is where professional traders spend 80% of their analysis time. Here's how to read it like a pro.
What Is an Option Chain?
An option chain displays all available strike prices for Nifty options with key data points:
Left Side - Call Options:
Volume
Open Interest (OI)
Change in OI
Last Traded Price (LTP)
Bid/Ask prices
Implied Volatility (IV)
Center - Strike Prices:
All available strikes from deep ITM to deep OTM
Right Side - Put Options:
Same data points as calls but for put options
Where to Access Live Option Chain Data
You can view real-time option chain on:
NSE Official Website - Free, most reliable, but basic interface
Your Trading Platform - Built into most broker apps (check your broker's platform)
Financial Portals - Various financial websites offer option chain views
Pro Tip: Use your broker's native platform for actual trading as data is synchronized with order execution.
Critical Data Points to Analyze
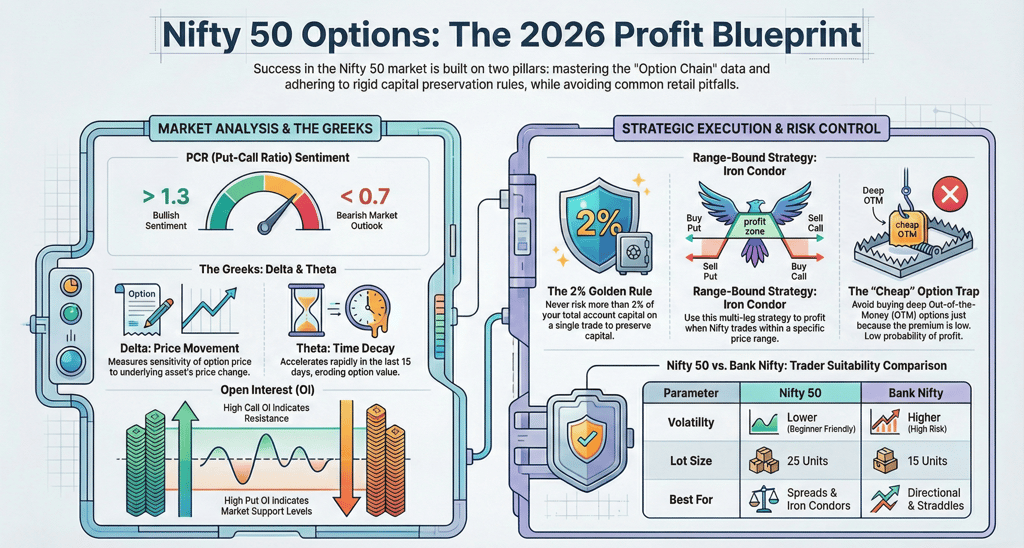
1. Open Interest (OI)
Open Interest represents the total number of outstanding contracts.
How to use OI:
High Call OI at a strike = Resistance level (many traders sold calls, don't expect price to cross easily)
High Put OI at a strike = Support level (many traders sold puts, expecting price to hold)
Change in OI = More important than absolute OI
Example:
Strike: 22,000 Call OI: 5,00,000 contracts Put OI: 2,00,000 contracts Interpretation: Strong resistance at 22,000 (heavy call writing)
2. PCR Ratio (Put-Call Ratio)
Formula: Total Put OI ÷ Total Call OI
How to interpret:
PCR > 1.3 = Bullish signal (more puts written, market expected to go up)
PCR 0.8 - 1.2 = Neutral zone
PCR < 0.7 = Bearish signal (more calls written, market expected to go down)
Important: PCR is a contrarian indicator. High put writing suggests traders expect upside.
3. Implied Volatility (IV)
IV indicates expected price movement. Higher IV = Higher premium.
Trading rules:
Buy options when IV is LOW (cheaper premiums)
Sell options when IV is HIGH (collect higher premiums)
Avoid buying options before major events (IV crush after event can wipe gains)
Typical IV levels:
Low volatility: 12-16%
Normal: 16-22%
High volatility: 22-30%+
Panic levels: 35%+
4. Volume vs Open Interest
High Volume + Rising OI = New positions being added (strong trend)
High Volume + Falling OI = Positions being closed (trend may reverse)
Low Volume = Avoid that strike (poor liquidity)
Option Chain Analysis Strategy (Step-by-Step)
Step 1: Note current Nifty level (e.g., 22,000)
Step 2: Look at ATM and nearby strikes (21,900 to 22,100)
Step 3: Identify max Call OI strike (resistance) and max Put OI strike (support)
Step 4: Check PCR ratio for market sentiment
Step 5: Observe IV levels (avoid buying if IV is elevated)
Step 6: Look for strikes with high volume (ensures good liquidity)
Step 7: Note change in OI during the day (shows where fresh positions are being built)
Real Example:
Nifty Level: 22,000 Max Call OI: 22,200 (Resistance) Max Put OI: 21,800 (Support) PCR: 1.15 (Neutral to slightly bullish) IV: 18% (Normal range) Strategy: Nifty likely to trade between 21,800-22,200 today Consider selling 22,200 Call + 21,800 Put (Iron Condor strategy)
The Greeks: Understanding What Moves Your Option Price
Every option has four main "Greeks" that determine its price movement. Understanding these is NON-NEGOTIABLE for success.
Delta (Δ): Directional Risk
What it means: How much option price changes for ₹1 move in Nifty
Values:
Call options: 0 to 1 (or 0 to 100 if expressed as percentage)
Put options: -1 to 0 (or -100 to 0)
Practical application:
Delta 0.50 means if Nifty moves ₹100, option moves ₹50
ATM options have delta around 0.5
Deep ITM options have delta close to 1 (move almost 1:1 with index)
OTM options have low delta (0.1-0.3)
Trading tip: Buy options with delta 0.3-0.6 for best balance of cost and movement.
Theta (Θ): Time Decay
What it means: How much option value you LOSE each day
Key points:
ALL options lose value every day (if all else stays same)
Time decay accelerates in last 15 days before expiry
ATM options have highest theta
This is why option BUYERS often lose money
Example:
Monday: Option worth ₹100, Theta = -₹2
Tuesday: Option worth ₹98 (if nothing else changes)
By Thursday expiry: Massive decay
Strategy implication:
Option buyers: Trade with at least 2-3 weeks to expiry
Option sellers: Sell options in last 15 days to capture maximum theta decay
Vega (V): Volatility Sensitivity
What it means: How much option price changes for 1% change in volatility
Key insights:
High vega = Option price very sensitive to volatility changes
OTM options have higher vega than ITM options
Volatility increases = All option premiums increase
Volatility decreases = All option premiums decrease (volatility crush)
Common mistake: Traders buy options before RBI policy/budget, premium is high due to elevated IV. After event, even if direction is right, IV drops sharply and option loses value.
Smart approach: Sell options when IV is elevated, buy when IV is low.
Gamma (Γ): Delta Acceleration
What it means: How much delta changes for ₹1 move in Nifty
Why it matters:
ATM options have highest gamma
As expiry approaches, gamma increases
This creates rapid gains/losses near expiry
Use case: On expiry day, ATM options can swing wildly due to high gamma.
Putting Greeks Together: Example
Scenario: You buy Nifty 22,000 Call when Nifty is at 21,950
Option Details:
Premium: ₹80
Delta: 0.45
Theta: -₹3 per day
Vega: ₹15
Gamma: 0.05
What happens:
If Nifty rises to 22,000 (up ₹50):
Gain from delta: ₹50 × 0.45 = ₹22.5
Loss from theta (1 day): -₹3
Net premium: ₹80 + 22.5 - 3 = ₹99.5 ✅
If Nifty stays at 21,950 (no movement for 3 days):
Gain from delta: ₹0
Loss from theta (3 days): -₹9
Net premium: ₹80 - 9 = ₹71 ❌
This is why "time decay kills option buyers."
Proven Nifty 50 Option Trading Strategies for 2026
Let's move from theory to actionable strategies you can implement today.
Strategy 1: ATM Straddle (Directional Breakout Play)
When to use: Expecting big move but unsure of direction (RBI policy, budget, global events)
How it works:
Buy ATM Call + Buy ATM Put simultaneously
Profit if Nifty moves significantly in EITHER direction
Maximum loss = Total premium paid (if Nifty stays flat)
Example:
Nifty at 22,000
Buy 22,000 Call @ ₹100
Buy 22,000 Put @ ₹95
Total cost: ₹195 × 25 = ₹4,875
Profit scenarios:
If Nifty moves to 22,300: Call gains ₹300, Put expires worthless → Net profit ₹105/lot
If Nifty moves to 21,700: Put gains ₹300, Call expires worthless → Net profit ₹105/lot
Breakeven: 22,195 or 21,805
Risk management:
Use only during high-impact events
Exit if volatility drops sharply (IV crush)
Don't hold till expiry
Strategy 2: Bull Call Spread (Moderate Upside View)
When to use: Moderately bullish on Nifty, expecting 100-200 point rise
How it works:
Buy lower strike Call (ITM or ATM)
Sell higher strike Call (OTM)
Net cost is lower than buying call alone
Profit capped but so is loss
Example:
Nifty at 22,000, expecting move to 22,150
Buy 22,000 Call @ ₹120
Sell 22,200 Call @ ₹40
Net cost: ₹80 × 25 = ₹2,000
Outcome:
Max profit: (22,200-22,000) - 80 = ₹120/share × 25 = ₹3,000
Max loss: ₹2,000 (premium paid)
Breakeven: 22,080
Risk-reward: 1:1.5
Advantages:
Lower cost than naked call buying
Defined risk
Benefits from time decay on short call
Strategy 3: Iron Condor (Range-Bound Market)
When to use: Expecting Nifty to trade in a range (most common scenario)
How it works:
Sell OTM Call
Buy further OTM Call (protection)
Sell OTM Put
Buy further OTM Put (protection)
Example:
Nifty at 22,000, expecting range 21,800-22,200
Sell 22,200 Call @ ₹40
Buy 22,300 Call @ ₹20
Sell 21,800 Put @ ₹45
Buy 21,700 Put @ ₹25
Net credit received: (40-20) + (45-25) = ₹40 × 25 = ₹1,000
Outcome:
Max profit: ₹1,000 (if Nifty stays between 21,800-22,200)
Max loss: (Spread width × lot size) - Premium received
Breakeven points: 22,240 and 21,760
Best practices:
Deploy in low-volatility environments
Exit at 50% profit (don't wait for 100%)
Adjust or exit if Nifty approaches either strike
Strategy 4: Long Put (Hedging Your Portfolio)
When to use: You hold stocks worth ₹10 lakhs and want downside protection
How it works:
Buy OTM Put options on Nifty
If market crashes, put profits offset stock losses
If market rises, you lose only put premium but stocks gain
Example:
Portfolio value: ₹10,00,000
Nifty at 22,000
Buy 21,500 Put @ ₹50
Cost: ₹50 × 25 = ₹1,250
If market crashes 10%:
Stock portfolio loss: ₹1,00,000
Nifty drops to 19,800
Put value: ₹1,700 (ITM by 1,700 points)
Put profit: (1,700-50) × 25 = ₹41,250
While this doesn't fully hedge, it cushions the fall significantly.
Cost of insurance: ₹1,250 (0.125% of portfolio)
Strategy 5: Ratio Call Spread (Aggressive Bullish)
When to use: Very bullish but want to reduce cost
How it works:
Buy 1 ATM Call
Sell 2 OTM Calls
Example:
Buy 1 lot of 22,000 Call @ ₹120
Sell 2 lots of 22,300 Call @ ₹40 each
Net cost: 120 - (40×2) = ₹40 × 25 = ₹1,000
Outcome:
Max profit: At 22,300 (sweet spot)
Risk: Unlimited if Nifty rises sharply above 22,300
Max loss: ₹1,000 if Nifty stays below 22,000
Warning: This is a risky strategy. Use only if highly confident about target level.
Strategy 6: Calendar Spread (Theta Decay Strategy)
When to use: Expecting near-term consolidation, then bigger move
How it works:
Sell near-expiry ATM option
Buy same-strike option with later expiry
Example:
Sell Nifty 22,000 Call expiring this week @ ₹100
Buy Nifty 22,000 Call expiring next month @ ₹180
Net cost: ₹80 × 25 = ₹2,000
Logic: Near-term option decays faster (high theta). Far-term option holds value.
Best practices:
Use in low-volatility environments
Monitor daily; adjust if needed
Exit near-term option 2-3 days before expiry
Risk Management: The ONLY Way to Survive Long-Term
Here's the harsh truth: Your strategy doesn't matter if your risk management is poor.
Rule #1: Never Risk More Than 2% Per Trade
Formula:
Position Size = (Account Size × 2%) ÷ (Entry Price - Stop Loss)
Example:
Account size: ₹2,00,000
Risk per trade: 2% = ₹4,000
Buying Nifty Call @ ₹100
Stop loss @ ₹70 (₹30 risk per unit)
Maximum lots: ₹4,000 ÷ (30 × 25) = 5.33 → Trade 5 lots maximum
Rule #2: Use Stop Losses ALWAYS
For option buyers:
Time-based stop: Exit if no movement in 2-3 days
Price-based stop: Exit at 30-40% loss from entry
For option sellers:
Strict stop loss at 50% of premium received
Example: Sold option at ₹100, exit if it reaches ₹150
Rule #3: Don't Overtrade on Expiry Day
Why traders lose on expiry:
Extreme volatility in last 1-2 hours
Greeks become unpredictable
Liquidity can dry up suddenly
Small movements create large swings
Smart approach:
Square off positions by 2:30 PM on expiry day
Don't initiate new positions after 1 PM
If holding till expiry, only sell deep OTM options with clear stop loss
Rule #4: Position Sizing Based on Strategy
Capital allocation guidelines:
Strategy Risk Level Max Capital Allocation Directional buying High 20-30% Credit spreads Medium 30-40% Debit spreads Medium 25-35% Iron Condor Low-Medium 40-50% Hedging Low 10-15%
Never deploy all capital at once. Keep 40-50% in reserve.
Rule #5: Track Your Performance
Maintain a trading journal with:
Date and time of trade
Strategy used
Entry and exit prices
Profit/loss
Market conditions
What went right/wrong
Emotional state
Review monthly to identify:
Which strategies work best for you
Common mistakes
Optimal trade timing
Risk-reward patterns
Common Mistakes Nifty Options Traders Make (And How to Avoid Them)
Mistake #1: Buying Deep OTM Options Because They're "Cheap"
Why it fails:
Very low probability of profit
Massive time decay
Need huge moves to profit
Example:
Nifty at 22,000
Buying 23,000 Call @ ₹10 (looks cheap!)
Needs 5%+ move JUST to breakeven
Probability: Less than 10%
Better approach: Trade ATM or slightly OTM options (higher probability, better liquidity)
Mistake #2: Holding Options Till Expiry
The problem:
Time decay accelerates dramatically
Last-day volatility is unpredictable
Can turn winning trade into losing one in final hours
Statistics: 80% of options expire worthless
Solution:
Exit profitable trades at 50-70% of max profit
Don't wait for 100% profit
Close losing trades 2-3 days before expiry
Mistake #3: Ignoring Implied Volatility
Scenario:
Budget day approaching
IV spikes to 35% (normally 18%)
Trader buys calls thinking market will rally
Market DOES rally, but option loses value (IV crush)
Why: Premium was inflated due to high IV. After event, IV drops to normal levels, eroding premium.
Smart play: SELL options when IV is elevated, BUY when IV is low.
Mistake #4: Not Understanding Lot Size Impact
Example mistake:
Trader with ₹1 lakh account
Buys 10 lots of Nifty Call @ ₹100
Total cost: ₹25,000 (25% of capital)
Nifty moves 50 points against them
Loss: ₹12,500+ (12.5% account blown in one trade!)
Correct approach: Risk only 2% per trade = ₹2,000 in above example.
Mistake #5: Revenge Trading After Losses
Pattern:
Lose ₹5,000 on a trade
Immediately enter another trade to "recover losses"
No analysis, pure emotion
Lose another ₹5,000
Solution:
Take a break after 2 consecutive losses
Review what went wrong
Come back with clear mind
Never try to "recover" losses in one trade
Mistake #6: Following Random Tips
Why it's dangerous:
No understanding of rationale
Different risk profiles
No exit plan
Timing issues
Better approach: Learn to analyze yourself using option chain and technical indicators.
Advanced Option Chain Analysis Techniques
Once you master basics, use these advanced techniques:
Technique 1: Max Pain Theory
Concept: Option writers (institutions) have more power. They try to ensure maximum options expire worthless.
Max Pain Level: Strike price where maximum value of options (calls + puts) expire worthless.
How to use:
Calculate max pain before expiry day
If Nifty is far from max pain, expect gravitational pull toward it
Not 100% accurate but useful reference
Calculation available on various websites - check your analysis platform
Technique 2: Change in OI Analysis (Intraday)
Track how OI changes during the trading session:
Bullish signals:
Put OI increasing + Put premiums decreasing = Put writing (bullish)
Call OI decreasing + Nifty rising = Call covering (bullish)
Bearish signals:
Call OI increasing + Call premiums decreasing = Call writing (bearish)
Put OI decreasing + Nifty falling = Put covering (bearish)
Technique 3: IV Percentile Ranking
Instead of looking at absolute IV, check where current IV ranks historically:
IV Rank < 25%: Low volatility environment → Buy options/straddles
IV Rank 25-50%: Moderate → Use spreads
IV Rank 50-75%: Elevated → Consider selling strategies
IV Rank > 75%: Very high → Sell options/iron condors
Technique 4: Volume-Weighted OI
Not all OI is equal. Check:
OI with high volume = Fresh positions (more significant) OI with low volume = Old positions (less relevant)
Focus on strikes with both high OI AND rising volume.
Tools and Calculators Every Nifty Options Trader Needs
Essential Tools
1. Option Premium Calculator
Calculate theoretical option price
Test different scenarios (price movement, time decay, volatility)
Available free on most broker platforms
2. Profit/Loss Calculator
Visualize payoff diagrams
Understand max profit/max loss scenarios
Essential for multi-leg strategies
3. Position Size Calculator
Calculate how many lots to trade based on risk
Ensures you follow 2% rule
Prevents over-leveraging
4. Brokerage Calculator
Total cost includes: Brokerage + STT + Exchange charges + GST + Stamp duty
Can eat 10-15% of small profits
Know your all-in cost before trading
5. Margin Calculator
For option selling strategies
Know exact margin required
Avoid margin calls
Recommended Analysis Approach
Morning routine (before 9:15 AM):
Check overnight global market moves
Identify key support/resistance levels
Review option chain for max Call OI and Put OI
Calculate PCR ratio
Note current IV levels
Identify potential trade setups
During market hours:
Monitor real-time option chain
Track change in OI
Watch for unusual volume in specific strikes
Adjust positions if stop loss hit
Book profits at predefined targets
Post-market (after 3:30 PM):
Review all trades executed
Update trading journal
Calculate P&L
Identify lessons learned
Plan for next day
Weekly vs Monthly Options: Which Should You Trade?
Weekly Options Characteristics
Advantages:
Lower capital requirement
Faster theta decay (good for sellers)
More frequent trading opportunities
Tighter risk management
Disadvantages:
Higher brokerage costs (more trades)
Need constant monitoring
Less time for trades to work out
Higher stress
Best for: Active traders, option sellers, short-term strategies
Monthly Options Characteristics
Advantages:
More time for trades to develop
Lower transaction costs
Less stressful
Better for directional views
Disadvantages:
Higher capital requirement
Slower theta decay
Less flexible
Best for: Swing traders, part-time traders, directional strategies
Which One Should You Choose?
Trade weekly options if:
You can monitor markets during trading hours
You prefer option selling strategies
You have smaller capital
You like short-term trades
Trade monthly options if:
You have a day job
You prefer longer-term views
You want less frequent trading
You're an option buyer
Pro approach: Use a mix
70% in monthly options for core strategies
30% in weekly options for quick trades
Tax Treatment of Nifty Options in India (2026)
Understanding tax implications is crucial for net profitability.
How Options Profits Are Taxed
Classification: Speculative Business Income
Tax Treatment:
Profits added to your total income
Taxed at your income slab rate (up to 30%)
No preferential treatment like LTCG
Important Points:
Options trading is NOT treated as capital gains
STT (Securities Transaction Tax) already deducted on sell side
Losses can be set off only against speculative income
Can carry forward losses for 4 years
What You Need to Maintain
Documentation:
Contract notes for all trades
P&L statements from broker
Bank statements showing fund transfers
Brokerage bills
Tax Filing:
File ITR-3 (for business income)
Declare all trading income
Claim trading expenses (brokerage, internet, data charges)
Deductions You Can Claim:
Brokerage and transaction charges
Internet and phone bills (proportionate)
Trading software subscriptions
Educational courses (trading related)
Depreciation on computer/laptop
Pro tip: Consult a CA specializing in trading income for optimal tax planning. Set aside 30-35% of profits for tax.
Nifty 50 vs Bank Nifty: Which Is Better for Options Trading?
Nifty 50 Characteristics
Advantages:
Lower volatility (smoother moves)
Better for beginners
More predictable patterns
Less capital intensive
Disadvantages:
Smaller moves (lower profit potential)
Lower premiums
Slower action
Best for: Conservative traders, beginners, portfolio hedging
Bank Nifty Characteristics
Advantages:
Higher volatility (bigger moves)
Higher premiums
More profit potential
Exciting action
Disadvantages:
Higher risk
Requires more capital
More difficult to predict
Higher stress
Best for: Experienced traders, active traders, high-risk appetite
Practical Comparison
Parameter Nifty 50 Bank Nifty Lot Size 25 15 Avg Daily Move 100-200 pts 300-600 pts Premium Cost Lower Higher Margin Required Lower Higher Difficulty Level Easier Harder Best Strategy Type Spreads, Iron Condors Directional, Straddles
Recommendation:
Start with Nifty 50 to learn
Graduate to Bank Nifty once consistent
Or trade both: 70% Nifty, 30% Bank Nifty
Building Your Nifty Options Trading System
A systematic approach beats random trading every time. Here's how to build yours:
Step 1: Define Your Trading Personality
Ask yourself:
How much time can I dedicate daily?
What's my risk tolerance?
Do I prefer technical or fundamental analysis?
Am I comfortable with overnight positions?
Trader types:
Intraday Trader
Screen time: 4-6 hours daily
Capital: ₹50,000-₹2,00,000
Strategies: Quick directional trades, scalping
Average trades: 3-5 per week
Swing Trader
Screen time: 1-2 hours daily
Capital: ₹1,00,000-₹5,00,000
Strategies: Multi-day positions, spreads
Average trades: 2-3 per week
Position Trader
Screen time: 30 minutes daily
Capital: ₹2,00,000+
Strategies: Monthly options, hedging
Average trades: 1-2 per week
Step 2: Choose Your Core Strategies (Maximum 3-4)
Don't try to master everything. Pick based on your personality:
For conservative traders:
Bull/Bear spreads
Iron Condor
Covered strategies
For moderate risk-takers:
Straddles/Strangles (event-based)
Calendar spreads
Ratio spreads
For aggressive traders:
Naked options (with strict stops)
Ratio spreads
Gamma scalping
Step 3: Define Entry Rules
Technical entry triggers:
Specific chart patterns
Indicator combinations
Support/resistance levels
Option chain triggers:
PCR crossing specific threshold
OI buildup at key strikes
IV percentile ranking
Example entry rule:
Bull Call Spread Entry: 1. Nifty forms bullish candlestick pattern on daily chart 2. PCR > 1.2 (bullish sentiment) 3. IV percentile < 50% (not elevated) 4. Current time < 2:00 PM (enough time in day) 5. Risk-reward > 1:2 If ALL conditions met → Execute trade
Step 4: Define Exit Rules
Profit targets:
Exit at 50% of max profit (spreads)
Exit at 100% profit for directional trades
Time-based: Exit 3 days before expiry
Stop losses:
30-40% loss for option buying
50% of premium for option selling
Technical level breach
Example exit rule:
If profit reaches ₹3,000 per lot → Exit immediately If loss reaches ₹1,500 per lot → Exit immediately If holding for 3 days with no movement → Exit If VIX spikes above 25 → Reassess all positions
Step 5: Position Sizing
Formula:
Maximum lots per trade = (Account size × 2%) ÷ (Risk per lot)
Example:
Account: ₹2,00,000
Risk per trade: 2% = ₹4,000
Strategy: Buy Call @ ₹100, Stop loss @ ₹70
Risk per lot: ₹30 × 25 = ₹750
Max lots: 4,000 ÷ 750 = 5.3 → Trade 5 lots maximum
Step 6: Create Your Daily Routine
Pre-market (8:45 AM - 9:15 AM):
Review overnight global news
Check SGX Nifty indication
Note key support/resistance
Review open positions
Market hours (9:15 AM - 3:30 PM):
Monitor watchlist
Execute setups that meet criteria
Track existing positions
Adjust stops if needed
Post-market (After 3:30 PM):
Update trading journal
Review today's trades
Calculate P&L
Prepare watchlist for tomorrow
Step 7: Weekly Review
Every weekend:
Calculate week's total P&L
Win rate analysis
Average profit vs average loss
Which strategies performed best
Mistakes made and lessons learned
Monthly review:
Overall account performance
Strategy-wise breakdown
Risk metrics (max drawdown, Sharpe ratio)
Adjustments needed for next month
Psychology of Options Trading: Master Your Mind First
Technical analysis and strategies mean nothing if you can't control your emotions.
The Biggest Psychological Challenges
1. Fear of Missing Out (FOMO)
Symptoms:
Entering trades without proper setup
Increasing position size after seeing others profit
Trading during lunch breaks or meetings
Solution:
Follow your trading plan strictly
Remember: There's ALWAYS another trade
Track trades you skipped (you'll see many would have lost)
2. Revenge Trading
Symptoms:
Immediately entering new trade after loss
Increasing position size to "recover" losses
Trading without analysis
Solution:
Rule: After 2 consecutive losses, take 1 day break
Accept losses as cost of doing business
Focus on process, not individual trade outcomes
3. Overconfidence After Wins
Symptoms:
Increasing position sizes
Skipping risk management
Taking unnecessary risks
Solution:
Keep position sizing consistent
Remember: One bad trade can wipe out 10 good ones
Stay humble, market is bigger than anyone
4. Paralysis by Analysis
Symptoms:
Watching setups but not executing
Waiting for "perfect" entry
Missing obvious opportunities
Solution:
Define clear entry criteria
Take the trade if conditions met
Accept that no trade is 100% certain
Developing Trading Discipline
Mental exercises:
1. Visualization (5 minutes daily)
Imagine executing your plan perfectly
Visualize taking losses calmly
See yourself following rules
2. Journaling (10 minutes post-market)
Write emotional state during trades
Note when you followed/broke rules
Identify patterns in your behavior
3. Mindfulness (10 minutes morning)
Meditation or deep breathing
Clears mind before trading
Reduces impulsive decisions
4. Physical exercise
Trading is mentally exhausting
Exercise releases stress
Better decision-making with healthy body
The Professional Trader Mindset
Think in probabilities, not certainties:
"This trade has 60% win probability" ✅
"This trade will definitely work" ❌
Focus on process, not outcomes:
"I followed my plan today" ✅
"I made ₹5,000 today" ❌ (outcome focus)
Accept losses as inevitable:
"I had 2 losses and 3 wins this week" ✅
"I should never lose" ❌
Stay patient:
"I'll wait for my setup" ✅
"I must trade daily" ❌
Your Action Plan: From Beginner to Consistent Trader
Month 1: Foundation (Paper Trading Only)
Goals:
Understand option chain completely
Learn to calculate Greeks
Practice with virtual money
Tasks:
Open paper trading account
Execute 30 trades (mix of strategies)
Maintain detailed journal
Study 2 strategies deeply
Success metric: Can analyze option chain independently
Month 2: Strategy Mastery (Continue Paper Trading)
Goals:
Master 2-3 core strategies
Develop entry/exit rules
Build trading routine
Tasks:
Trade ONLY your chosen strategies
Track win rate and profitability
Refine rules based on results
Start following real option chain live
Success metric: 55%+ win rate in paper trading
Month 3: Small Real Money (Start with ₹25,000-₹50,000)
Goals:
Experience real money emotions
Execute plan under pressure
Build confidence gradually
Tasks:
Trade minimum lot size only
Strict adherence to 2% rule
Risk maximum ₹500-₹1,000 per trade
Continue journaling
Success metric: Break even or small profit, more importantly - followed rules
Month 4-6: Scaling Gradually
Goals:
Increase capital slowly
Improve win rate
Develop consistency
Tasks:
Add capital only after profitable months
Increase lot size gradually (never more than 2 lots at a time)
Review and optimize strategies
Consider advanced strategies
Success metric: 3 consecutive profitable months
Month 7-12: Professional Approach
Goals:
Treat trading as business
Consistent monthly profits
Refine risk management
Tasks:
Diversify across strategies
Weekly and monthly reviews
Tax planning
Continue education
Success metric: 60%+ win rate, positive expectancy
Critical Resources for Nifty Options Traders
Educational Resources
1. NSE Learning Modules
Free certification courses
Options trading basics
Advanced strategies
2. Books to Read
"Option Volatility and Pricing" by Sheldon Natenberg
"Options as a Strategic Investment" by Lawrence McMillan
"The Options Playbook" by Brian Overby
3. YouTube Channels (Search for India-specific options content)
Look for channels focusing on education, not tips
Avoid channels promising guaranteed profits
Communities and Forums
Join online communities where traders share:
Strategy discussions
Trade reviews
Market analysis
Risk management tips
Warning: Avoid groups focused on "calls" or "tips." Focus on educational communities.
Professional Development
Consider professional training if:
You're serious about trading as career
You want personalized guidance
You need accountability
What to look for in training:
Live market demonstrations
Real trade reviews (wins AND losses)
Strong focus on risk management
Post-training support
Small batch sizes
At Amuktha Trading in Hyderabad:
We offer comprehensive Nifty options training
Small batches with personal attention
Practical, not just theoretical approach
Focus on building YOUR trading system
Ongoing support and community
Conclusion: Your Path to Nifty Options Success
Nifty 50 options trading offers incredible opportunities—but success requires:
1. Knowledge:
Deep understanding of options mechanics
Mastery of option chain analysis
Greek literacy
2. Strategy:
Clear, tested strategies
Defined entry and exit rules
Multiple strategies for different conditions
3. Risk Management:
2% rule religiously followed
Stop losses on every trade
Proper position sizing
4. Psychology:
Emotional control
Discipline to follow rules
Patience to wait for setups
5. Continuous Learning:
Markets evolve constantly
Always learning and adapting
Regular performance reviews
Remember:
✅ Options are tools, not lottery tickets ✅ Small consistent gains beat big risky swings ✅ Risk management matters more than strategy ✅ Process focus leads to profitable outcomes ✅ Patience and discipline separate winners from losers
Take Your Next Step Today
Free Resources to Get Started
Download Our FREE Nifty Options Toolkit:
Option chain analysis checklist
Position sizing calculator (Excel)
Trading journal template
Greek reference guide
Strategy comparison chart
Ready for Professional Training?
Join our Nifty Options Mastery Course: ✅ 8-week comprehensive program ✅ Live market training ✅ Personal mentorship ✅ Real trade reviews ✅ Strategy templates ✅ 3 months post-training support
Special offer for serious traders:
First 2 sessions satisfaction guaranteed
Money-back if not satisfied
Flexible weekend and weekday batches
Contact Us
📞 Phone: +91 738-217-7772 (9 AM - 6 PM IST)
💬 WhatsApp: Click to chat about Nifty Options Training
📧 Email: contact@amuktha.com
📍 Location: Telangana, India
Schedule Free Consultation
Discuss your trading goals
Get personalized strategy recommendations
Understand our training methodology
Ask any questions about options trading
No obligation, just honest guidance
Frequently Asked Questions
Q: How much capital do I need to start trading Nifty options? A: Minimum ₹50,000, but ₹1-2 lakhs is recommended for proper risk management and diversification.
Q: Can I make consistent monthly income from Nifty options? A: Yes, but it requires proper education, disciplined execution, and realistic expectations. Aim for 3-5% monthly returns, not 30-50%.
Q: Is option selling better than buying? A: Both have pros and cons. Selling has higher win rate but bigger losses. Buying has lower win rate but limited risk. Most professionals use a mix.
Q: Should I trade weekly or monthly options? A: Start with monthly options (more time to learn). Add weekly options once you're consistent.
Q: How much time do I need to dedicate daily? A: Minimum 1-2 hours for analysis and monitoring. If intraday trading, need 4-6 hours.
Q: Can I trade Nifty options part-time while working? A: Yes! Many successful traders have day jobs. Use longer-duration strategies and mobile alerts.
Q: What's the success rate for Nifty options traders? A: Statistically, 90% of traders lose money initially. However, with proper education and discipline, you can be in the profitable 10%.
Q: Do I need to know programming/coding? A: No, manual trading works perfectly fine. Coding is optional for automation.
Q: Can I trade from anywhere in India? A: Yes! Online trading accessible from anywhere with internet. We train students across India.
Q: How long before I become profitable? A: Typically 6-12 months of consistent learning and practice. No shortcuts exist.
Important Disclaimers
Risk Warning: Options trading involves substantial risk of loss and is not suitable for all investors. You can lose some or all of your invested capital. Only trade with money you can afford to lose.
No Guaranteed Returns: Past performance does not guarantee future results. Market conditions change constantly. No strategy works 100% of the time.
Educational Purpose: This guide is for educational purposes only and should not be construed as personalized investment advice. Always conduct your own research and consult with qualified financial professionals before making trading decisions.
Regulatory Compliance: Ensure you comply with all SEBI regulations, tax obligations, and broker terms when trading derivatives. Understand all risks involved.
Professional Guidance: For personalized trading advice, risk assessment, and strategy development, consider professional training or mentorship rather than relying solely on internet content.
Final Thought: Success Is a Journey, Not a Destination
The difference between profitable traders and those who blow up their accounts isn't intelligence or luck—it's discipline, risk management, and continuous learning.
Start small. Learn deeply. Practice extensively. Scale gradually.
Your journey to consistent Nifty options profits starts with one decision: to learn it right.
Make that decision today.
👉 WhatsApp Us to Begin Your Trading Journey
Last Updated: February 6, 2026
Author: Amuktha Trading, India
"In options trading, the person who knows how to lose is the one who eventually wins."
Disclaimer:- Trading in securities markets carries substantial risk and is not suitable for everyone. Past performance is not indicative of future results. This article is for educational purposes only and should not be construed as investment advice. Please conduct your own research and consult a SEBI-registered financial advisor before making trading or investment decisions.
© 2026 Amuktha Trading. Telangana, India. Serving global traders since 2013.