Price Action Trading in 2026: The Ultimate Guide for Nifty, Bank Nifty & Global Markets
Meta Title: Price Action Trading 2026 — Complete Guide | Amuktha Meta Description: Master price action trading in 2026 for Nifty, Bank Nifty & global markets. Learn setups, candlestick patterns & live strategies. Free guide by Amuktha Trading, Hyderabad.
తెలుగులో చదవాలంటే / हिंदी में पढ़ें / മലയാളത്തിൽ വായിക്കുക — Jump to the multilingual section at the bottom of this guide.
Want personalized coaching? WhatsApp the mentor directly: +91 7382177772
What Is Price Action Trading? (2026 Definition for Indian & Global Traders)
Price action trading is the method of making buy and sell decisions based solely on raw price movement — the open, high, low, and close of each candle — without depending on lagging indicators like RSI, MACD, or Bollinger Bands.
In 2026, with Indian retail participation at an all-time high (SEBI reports over 13.6 crore registered investors), price action trading has become the most searched trading method among Nifty 50, Bank Nifty, and midcap traders who are tired of conflicting indicator signals.
In plain terms: Every indicator you use — RSI, MACD, Moving Averages — is calculated from price. They are second-hand information. Price action is first-hand. You are reading the market directly, not through a delayed filter.
Price action works across all markets — Nifty 50, Bank Nifty, and Sensex intraday trading; midcap and smallcap swing trading on NSE and BSE; forex pairs like USD/INR, EUR/USD, and GBP/USD; US markets including the S&P 500, Nasdaq, and Dow Jones; commodities like MCX Gold, Crude Oil, and Silver; and crypto pairs like BTC/USDT and ETH/USDT.
It works everywhere because all markets are driven by the same force — human psychology expressed through buying and selling pressure. Once you learn to read that pressure on a chart, the market you are trading becomes secondary.
Why 2026 Is the Best Year to Learn Price Action Trading
The Indian trading landscape has shifted dramatically. Here is why price action is more relevant than ever in 2026.
SEBI's new F&O regulations — increased lot sizes, weekly expiry restrictions, and higher margin requirements — have made options trading harder for retail traders relying on mechanical indicator systems. Price action traders adapt faster because they read real-time order flow, not lagging signals.
Over 60% of NSE volume now comes from algorithmic traders and HFTs. Many retail indicators are optimized on historical data that no longer reflects current market behavior. Price action, by contrast, responds to what the market is doing right now.
Nifty increasingly mirrors moves in the Dow Jones and S&P 500, particularly during US market hours. Price action skills learned on Nifty charts translate directly to reading these global indices — giving Indian traders an edge across multiple markets.
With Zerodha, Upstox, and Angel One now processing millions of trades daily from mobile devices, traders need a simple, clean system. Price action — no indicators, just clean charts — is ideal for mobile trading decisions.
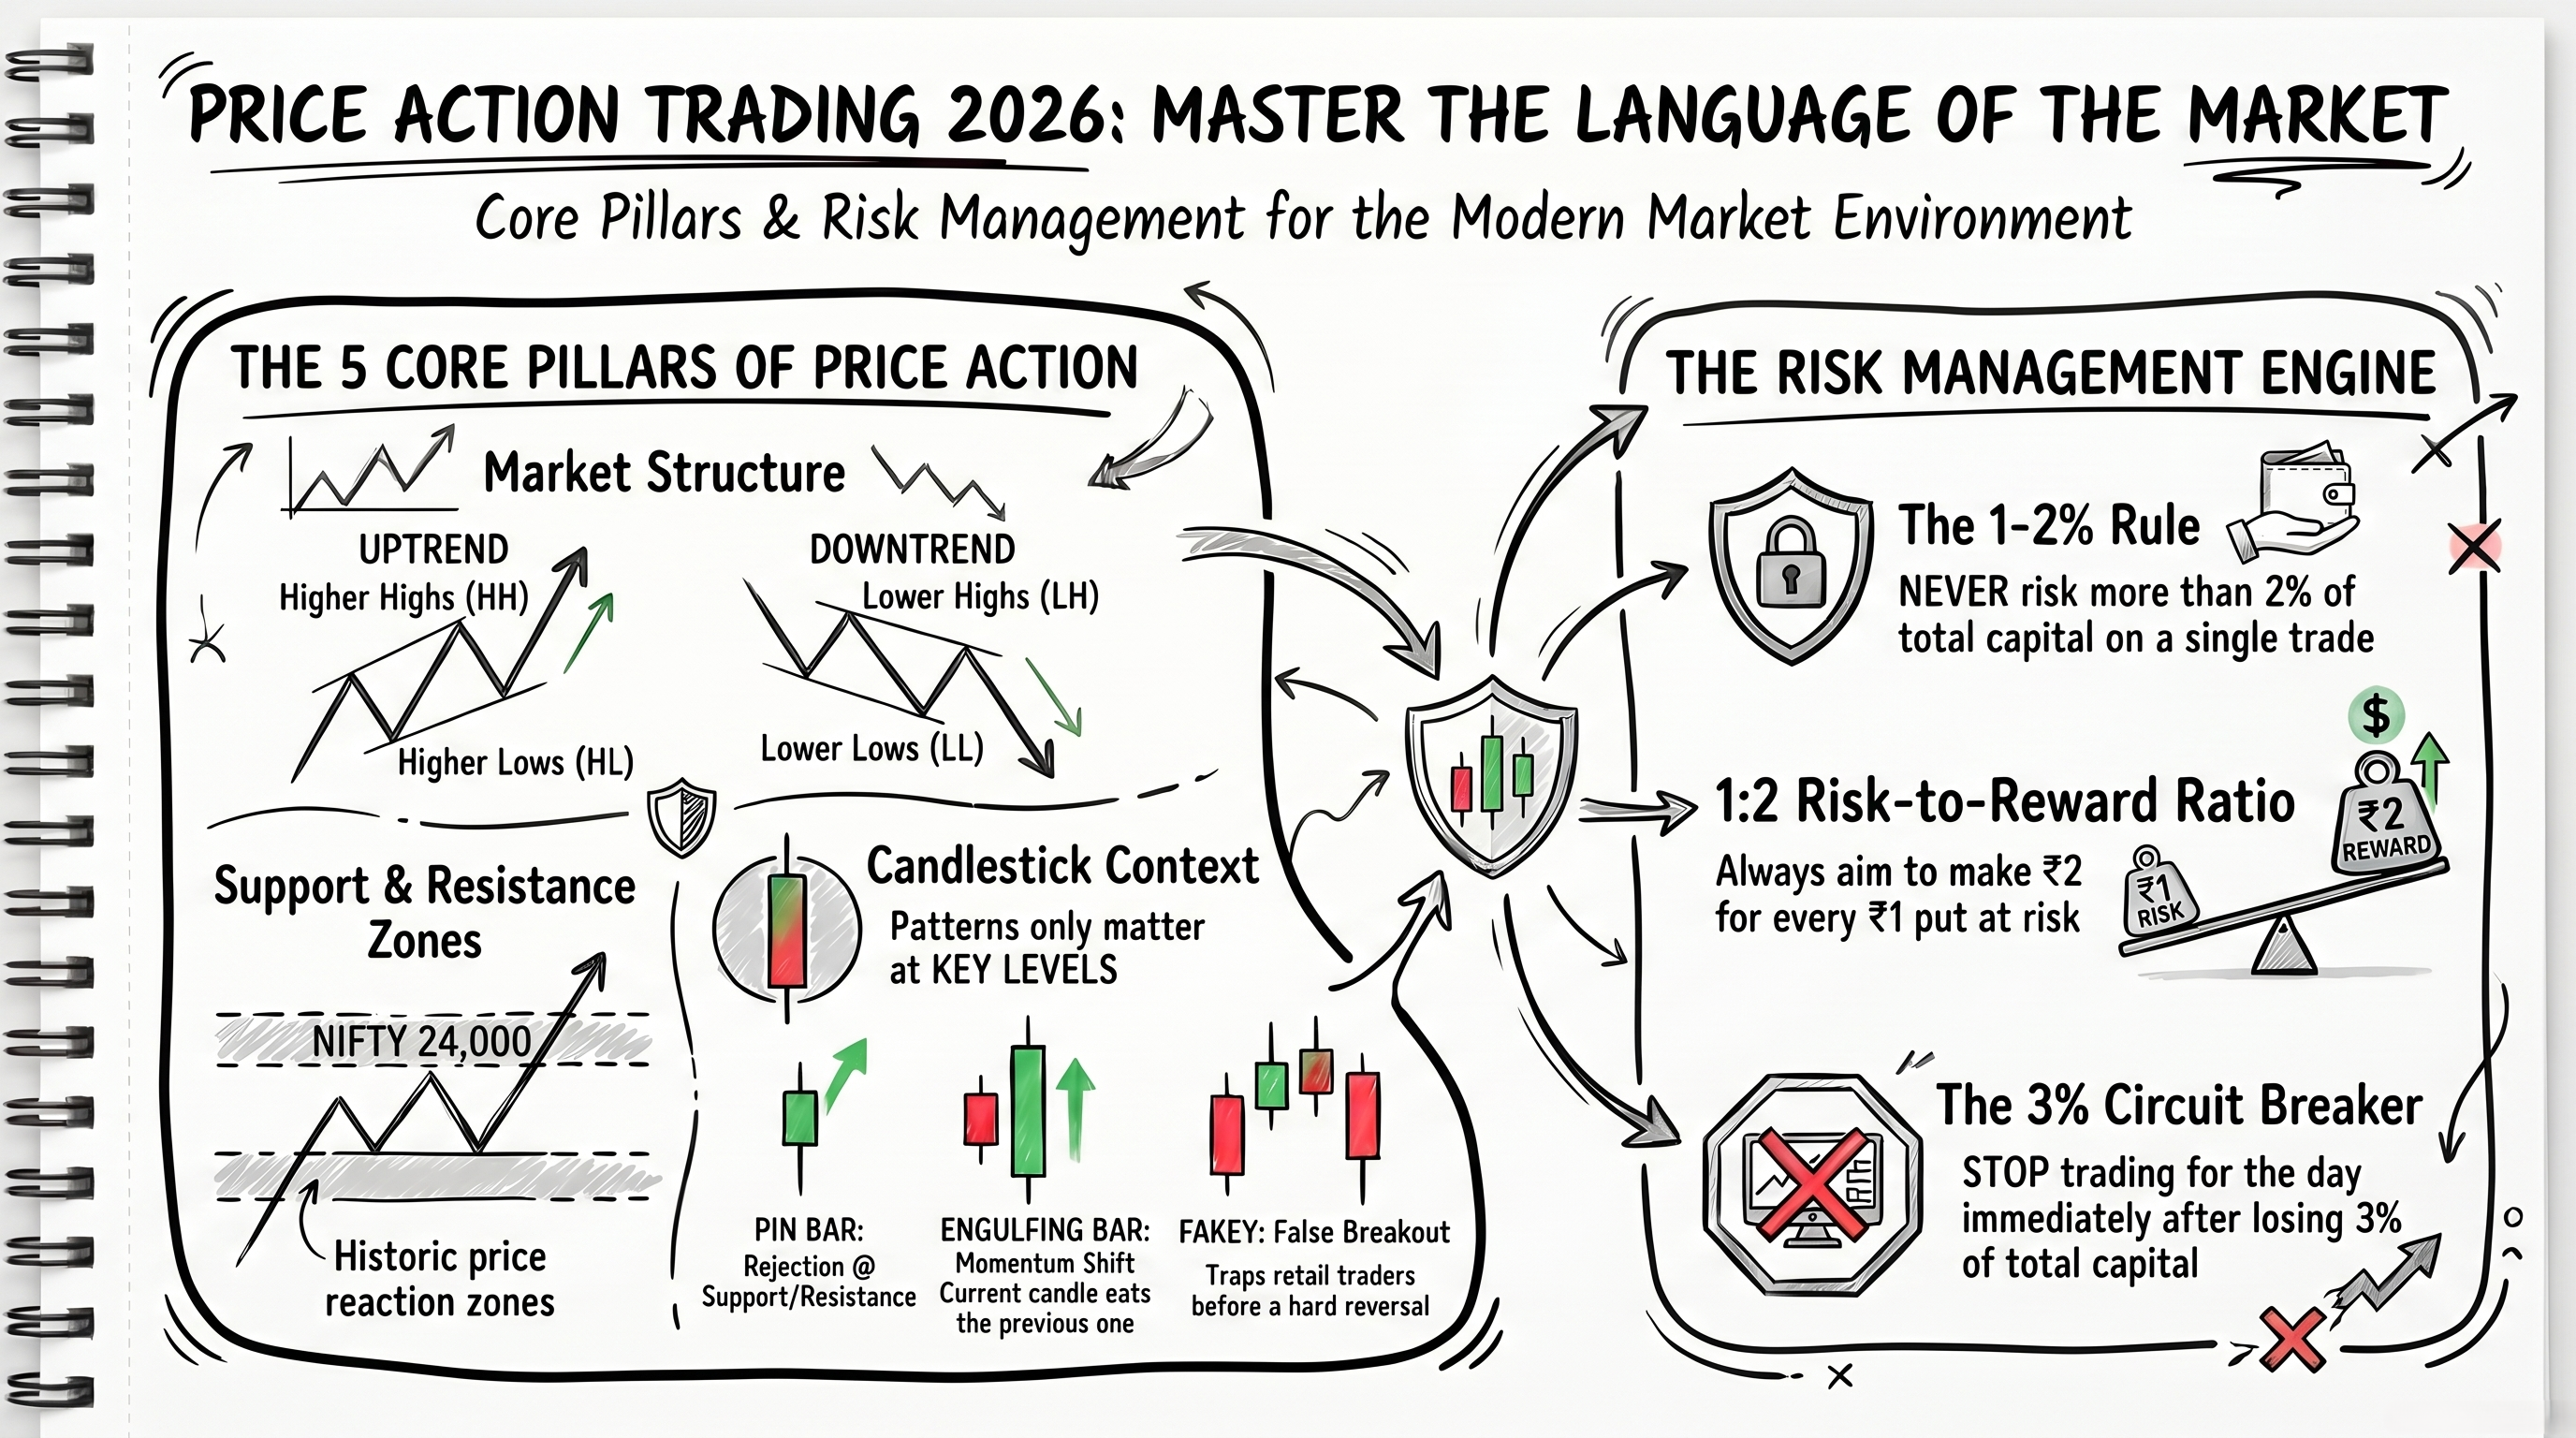
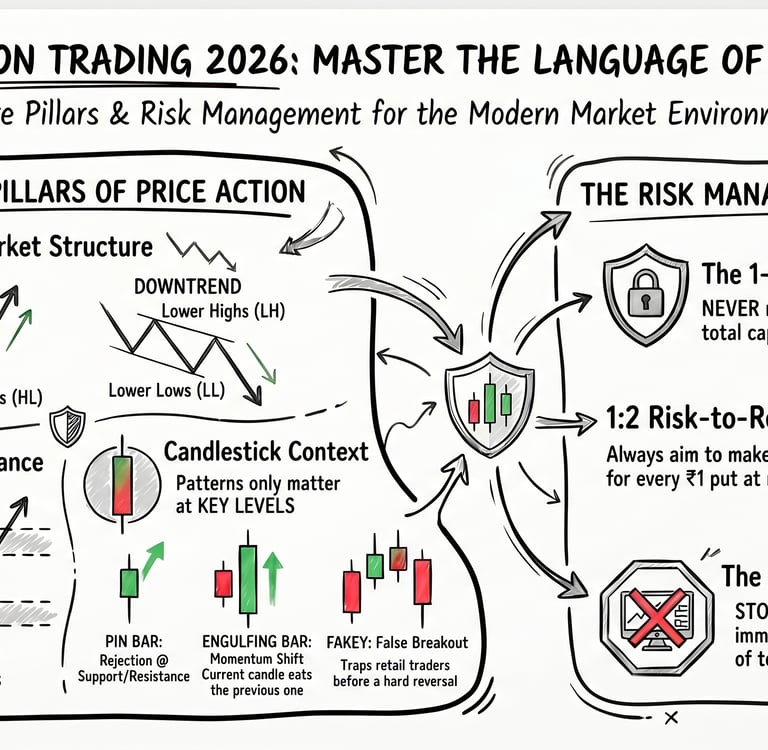
The 5 Core Pillars of Price Action Trading (With Nifty Examples)
Pillar 1: Market Structure
Market structure is the foundation. Before every trade, you must know whether the market is in an uptrend (making Higher Highs and Higher Lows), a downtrend (making Lower Highs and Lower Lows), or a ranging and consolidating phase where price oscillates between a defined support and resistance zone.
Between October 2025 and March 2026, Nifty built a clear structure of Higher Highs and Higher Lows on the daily chart, with each pullback finding support at the 21-day EMA zone. Price action traders identified this structure early and traded pullbacks to the 21 EMA — a setup that delivered 3–5% moves repeatedly without a single indicator.
The rule is simple: never enter a trade without first identifying the market structure on the higher timeframe (Daily or Weekly). Take setups only on the lower timeframe (15-minute or 1-hour) in the direction of the higher timeframe structure.
Pillar 2: Support and Resistance Zones
Support and resistance are not exact lines — they are zones where price has historically reacted. These zones represent areas of concentrated buying or selling interest from institutional traders and operators.
A strong zone has been visited at least two to three times. It aligns with a round number — for example, Nifty 22,000 or 23,500 or 24,000. It caused a sharp, fast reversal rather than a slow grind. And it aligns with a previous week's high or low.
Watch the Previous Day's High (PDH) and Previous Day's Low (PDL) on Nifty and Bank Nifty every single day. These are among the most respected price action levels on intraday charts. A breakout above PDH with a volume surge, followed by a retest, is one of the cleanest setups available to Indian intraday traders in 2026.
Pillar 3: Candlestick Patterns (With Context)
Candlestick patterns are meaningless without context. The same candle means entirely different things depending on where it appears on the chart. Here are the five most powerful patterns used by professional price action traders.
The Pin Bar has a long wick and a small body that closes near the open. It signals a strong rejection of a price level — buyers or sellers overwhelmed the opposite side. A high-probability setup is a bullish Pin Bar forming at a strong support zone on the Nifty daily chart after a pullback in an uptrend. You enter by buying the break of the Pin Bar's high and place your stop loss below the wick.
The Engulfing Bar is a candle that completely engulfs the body of the previous candle. It signals a decisive momentum shift — the previous candle's participants have been completely overwhelmed. A Bearish Engulfing Bar at a weekly resistance zone on Bank Nifty signals institutional selling. You sell the break of the engulfing bar's low with a stop loss above the engulfing bar's high.
The Inside Bar is a candle whose high and low are completely within the previous candle's range. It signals market consolidation — a pause before the next move, a compression of energy. It works best on the daily chart for swing trades and the 15-minute chart for intraday. Entry is on the break of the outside bar's high for a bullish breakout or its low for a bearish breakdown.
The Doji is a candle where the open and close are nearly equal, creating a cross shape. It signals indecision and balance between buyers and sellers. A Doji appearing at the top of a strong rally at resistance is significant — particularly powerful when followed by a bearish candle in the next session. A Doji in the middle of a range means almost nothing. A Doji at a major support or resistance level means a great deal.
The Fakey or False Breakout is when price breaks above a resistance level, trapping breakout buyers, then reverses hard back inside the range. It signals that institutional traders flushed out retail breakout buyers before moving price in the opposite direction. On Nifty, this looks like a break above PDH in the morning session by 20–30 points followed by a sharp reversal below that level. You enter short at the break of the previous candle's low with a stop above the fake breakout high. False breakouts trap the most traders, creating fast, aggressive moves in the reversal direction.
Pillar 4: Trend Continuations vs. Reversals
Knowing when to trade a continuation and when to trade a reversal is critical.
Trade continuations when the higher timeframe trend is clearly established, price pulls back to a key level (support in an uptrend, resistance in a downtrend), a rejection candle such as a Pin Bar or Engulfing forms at that level, and volume is lower during the pullback and picks up on the rejection candle. Continuation setups have a higher strike rate and are easier to manage psychologically.
Trade reversals only after an extended move where you see signs of exhaustion — slower rallies, shorter swings — combined with a strong, decisive reversal candle at a major historical level and alignment across multiple timeframes. For beginners, start exclusively with continuation setups. Reversals are for intermediate and advanced traders.
Pillar 5: Risk Management — The Engine of Price Action Trading
Even the best price action setup fails 40% of the time. Risk management is what separates profitable traders from those who blow accounts.
The non-negotiable rules are as follows. Never risk more than 1–2% of your total trading capital on a single trade. Place your stop loss below the rejection wick or outside the pattern — not at an arbitrary round number. Aim for a minimum Risk:Reward ratio of 1:2, meaning you risk ₹1 to make ₹2. Limit yourself to 3–4 high-quality setups per day for intraday trading. Stop trading entirely after losing 3% of your capital in a single day.
For position sizing, use this formula: divide the amount you are willing to risk (your account size multiplied by your risk percentage) by the difference between your entry price and your stop loss price. For example, with a ₹5,00,000 account, risking 1% (₹5,000), entering at ₹480 with a stop at ₹470 (a ₹10 risk per share), your position size is 500 shares. This formula works identically for Nifty futures lot sizing, stock F&O, and international markets — simply substitute ₹ with $, £, €, or AUD.
Price Action Trading Setups: 3 High-Probability Trades for 2026
Setup 1: The Nifty Morning Pullback Trade (Intraday)
This setup is best for intraday traders on Nifty 50 and Bank Nifty using the 15-minute chart.
On the 1-hour chart, identify the overall trend from the previous day's close and overnight gap. Mark the Previous Day's High (PDH) and Previous Day's Low (PDL). After the opening 15-minute candle closes, wait for price to pull back to a key zone — PDH, PDL, or a strong support or resistance from previous sessions. Look for a Pin Bar or Engulfing candle at that zone on the 15-minute chart. Enter on the break of the signal candle in the direction of the higher timeframe trend. Place your stop loss below the signal candle's low for longs or above its high for shorts. Target the next major resistance level or a minimum 1:2.5 Risk:Reward.
This works in 2026 because Indian institutional players — mutual funds and FIIs — often accumulate during the first 30–45 minutes of the session. The morning pullback setup lets retail traders piggyback on that institutional activity.
Setup 2: The Daily Chart Swing Trade (For Indian & Global Stocks)
This setup is best for swing traders holding positions for 3–10 days using the daily chart, with the weekly chart for trend confirmation.
Scan for stocks in a clear uptrend on the weekly chart, showing Higher Highs and Higher Lows. On the daily chart, wait for a pullback of 5–8% from the recent high. Look for the pullback to reach a previous breakout level or the 50-day moving average. A bullish Pin Bar or Bullish Engulfing at that level is your trigger. Enter at the next candle's open after the signal. Place your stop loss below the signal candle's low or the recent swing low. Target the previous high or a minimum 1:3 Risk:Reward.
This setup applies equally to NSE and BSE midcap stocks, US stocks on NYSE and NASDAQ, UK FTSE stocks, ASX 200 stocks in Australia, and DAX 40 stocks in Germany and Europe.
Setup 3: The False Breakout Fade (Advanced)
This setup is best for experienced intraday and swing traders using the 1-hour and 4-hour charts.
Identify a clear horizontal resistance zone that has been tested two to three times. Wait for price to break above the resistance by 0.3–0.5% — the fake breakout. Look for a quick reversal in the form of a bearish Pin Bar or Engulfing bar closing back below the resistance. Enter short on the close of the reversal candle. Place your stop loss 0.5% above the false breakout high. Target the support zone on the opposite end of the range.
This setup is particularly powerful on Bank Nifty during weekly options expiry days, on MCX Gold during US CPI data releases, and on EUR/USD and GBP/USD at London session opens.
How to Learn Price Action Trading for Free in 2026 — Step-by-Step Roadmap
You do not need an expensive course to start. Here is a structured, free learning path.
In weeks one and two, focus on foundations. Learn candlestick anatomy — the body, wick, open, and close. Study the difference between uptrend, downtrend, and ranging markets. Practice identifying Higher Highs and Higher Lows and Lower Highs and Lower Lows on Nifty daily charts using TradingView's free tier.
In weeks three and four, work on structure and levels. Mark support and resistance zones on five different charts every day. Identify PDH, PDL, and weekly highs and lows on Nifty and Bank Nifty. Practice drawing trendlines and look for at least three touch points for validity.
In weeks five and six, study patterns. Learn Pin Bars, Engulfing Bars, Inside Bars, and Dojis. Back-test each pattern on six months of Nifty historical data. Apply one critical rule throughout: only count patterns that form at a key level. Ignore patterns in the middle of a chart with no context.
In weeks seven and eight, build full setups. Combine structure, level, and pattern into complete trade setups. Journal every setup you would have taken — record the entry, stop, target, and outcome. Identify which setups have the best win rate for your trading style.
From weeks nine through twelve, move to live practice. Trade with a minimum lot size or a single stock (not F&O) to experience real emotions under real market conditions. Maintain a trade journal without exception — no journal means no improvement. Review every week: which patterns repeated, and where did you enter too early?
Want a personalized roadmap based on your current skill level and capital? WhatsApp the Amuktha mentor at +91 7382177772 for a free 15-minute chart review and customized learning plan.
Price Action vs. Indicator-Based Trading: The 2026 Reality Check
Price action gives you real-time signals because it is based on what the market is doing at this moment. Indicator-based trading gives you lagging signals because every indicator is calculated from past price data. By the time an indicator confirms a move, price action traders have already entered.
Price action keeps your chart completely clean — no overlapping lines, no conflicting signals, no visual noise. Indicators clutter the chart and often contradict each other, leaving traders paralyzed at the moment of decision.
Price action adapts to any market condition — trending, ranging, or volatile. Many indicators are designed for trending markets and produce endless false signals during choppy or sideways price action, which is how Indian indices behave for 40–50% of trading sessions.
The honest truth is that many successful traders use a combination — price action for entries and exits, with one or two indicators purely for trend context. The key is to let price be the decision-maker, not the indicator.
Recommended Price Action Resources in 2026
For books, start with Reading Price Charts Bar by Bar by Al Brooks, which is the most detailed bar-by-bar analysis available. Price Action Trading Secrets by Rayner Teo is beginner-friendly and highly practical. Trading in the Zone by Mark Douglas is essential for the psychological side of trading — every trader needs to read it regardless of their method. The Art and Science of Technical Analysis by Adam Grimes is rigorous and data-driven for those who want depth.
For free tools, TradingView's free tier is the best charting platform for price action — clean charts, a replay function for back-testing, and a large community. Zerodha Kite is excellent for Indian traders and supports clean candlestick charts natively. The NSE website provides free historical data for Nifty and all NSE-listed stocks.
For free community learning, explore TradingView's public charts section to study setups shared by experienced traders. Reddit communities like r/IndianStreetBets and r/Daytrading offer real-world trading discussions. Search "price action trading Nifty 2026" on YouTube for current, relevant chart examples.
Price Action Trading in India: Nifty, Bank Nifty & Stocks (2026 Specific Guide)
For Nifty 50, the best trading hours are 9:30 AM to 11:30 AM IST, which offer the highest liquidity and the cleanest price moves. Avoid the 12:00 PM to 1:30 PM IST window — the lunch hour produces choppy action and frequent false breakouts. Watch previous day high and low, previous week high and low, and round numbers at every 500 Nifty points as your primary levels every day. During monthly expiry week, Nifty tends to trend strongly — continuation setups perform best. During weekly expiry (Thursday), high volatility makes false breakout fades and reversal setups the most lucrative plays.
For Bank Nifty, remember that it moves two to three times more aggressively than Nifty — size your positions accordingly. Price action levels at major round numbers like 48,000, 50,000, and 52,000 are extremely well-respected by the market. On gap-up or gap-down openings where the gap exceeds 0.5%, always wait for the first 15-minute candle to close before entering. Since the 2024 expiry day change, Bank Nifty's weekly expiry falls on Wednesday — this is the day of highest premium decay and the most lucrative day for price action false breakout setups.
For midcap and smallcap stocks, use daily chart Pin Bars and Engulfing setups for 5–15 day swing trades. Volume confirmation is critical — a Pin Bar that forms on two to three times average volume is significantly more powerful than one on average or below-average volume. Avoid price action setups entirely in stocks with very low liquidity (under ₹10 crore in daily turnover).
Global Price Action Trading: US, UK, Europe, Australia & Canada (2026)
Price action principles are identical across all global markets. The adaptation is simply in session timing and relevant key levels.
For US markets including the S&P 500, Nasdaq, and Dow Jones, the most accessible trading hours for Indian traders are 7:00 PM to 10:00 PM IST, covering the US pre-market and early session. Watch previous day highs and lows, weekly pivot points, and round numbers (the S&P 500 reacts strongly at every 100-point interval). FOMC meeting days and CPI release days create the most powerful false breakout setups of the entire month.
For the United Kingdom and the FTSE 100, the London session opens at 2:30 PM IST and produces strong initial directional moves that frequently create morning pullback setups. Cable (GBP/USD) is the most active and cleanest price action forex pair during London hours.
For Europe, the DAX 40 in Germany has some of the cleanest price action setups globally due to high institutional participation and strong trending behavior. The Frankfurt open at 1:30 PM IST frequently aligns with a retest of the previous session's close, creating a reliable entry zone.
For Australia and the ASX 200, the session runs from 5:00 AM to 1:00 PM IST. Resources sector stocks — particularly mining companies — show very clean weekly chart price action because of their strong correlation with commodity price moves.
For Canada and the TSX, the market opens simultaneously with US markets. Energy and financial sector stocks show excellent daily chart swing setups that align cleanly with oil price action.
For forex trading, which runs 24 hours globally, USD/INR is highly relevant for Indian traders and businesses with dollar exposure. EUR/USD is the most liquid pair in the world and produces the cleanest price action setups. GBP/USD offers high volatility and is ideal for false breakout fades during the London session. One universal rule applies across all forex pairs: avoid trading 30 minutes before and after major news releases such as the US Non-Farm Payrolls, CPI data, and FOMC statements.
Multilingual Section — Price Action Trading Explained
हिंदी में | Price Action Trading in Hindi
Price action trading kya hai? Price action trading ek aisi trading method hai jisme aap sirf price ke movement ko dekhkar buy aur sell karte hain — kisi bhi indicator jaise RSI ya MACD ka use nahi hota. Sirf candles, support, resistance, aur market structure se trading decisions liye jaate hain.
2026 mein kyon seekhein? SEBI ke naye F&O rules ke baad, jo traders indicators par dependent the unhe bahut nuksaan hua. Price action traders ne in changes ko jaldi adapt kiya kyunki woh market ko direct padhna jaante hain.
Shuru kahan se karein? Pehle Nifty aur Bank Nifty ke daily charts par support aur resistance zones banana seekhein. Phir pin bar aur engulfing candles ki practice karein. TradingView ka free version use karein — clean charts ke liye bilkul perfect hai.
Mentor se baat karein: WhatsApp karein +91 7382177772 par aur apni trading ke baare mein seedhi guidance lein.
తెలుగులో | Price Action Trading in Telugu
Price action trading అంటే ఏమిటి? Price action trading అనేది ఒక trading పద్ధతి, దీనిలో మీరు RSI, MACD వంటి indicators ఉపయోగించకుండా, కేవలం price movement చూసి buy మరియు sell decisions తీసుకుంటారు. Candles, support, resistance మరియు market structure ద్వారా market ని నేరుగా చదువుతారు.
Nifty లో ఎలా apply చేయాలి? మొదట Nifty 50 daily chart లో uptrend మరియు downtrend structure గుర్తించడం నేర్చుకోండి. Previous Day High (PDH) మరియు Previous Day Low (PDL) levels mark చేయండి. ఆ levels దగ్గర pin bar లేదా engulfing candle వస్తే trade తీసుకోండి.
Free గా నేర్చుకోవడానికి TradingView free account తెరవండి మరియు Nifty charts పై daily practice చేయండి.
మీకు personalized coaching కావాలంటే WhatsApp చేయండి +91 7382177772 — Hyderabad లో ఉన్న అనుభవజ్ఞులైన mentor మీకు guide చేస్తారు.
മലയാളത്തിൽ | Price Action Trading in Malayalam
Price action trading എന്നാൽ എന്ത്? Price action trading എന്നത് ഒരു trading രീതിയാണ്, ഇതിൽ RSI, MACD തുടങ്ങിയ indicators ഉപയോഗിക്കാതെ, price-ന്റെ movement നോക്കി മാത്രം buy, sell തീരുമാനങ്ങൾ എടുക്കുന്നു. Candles, support, resistance, market structure ഇവ ഉപയോഗിച്ച് market-നെ നേരിട്ട് വായിക്കുന്ന ഒരു method ആണ് ഇത്.
2026-ൽ ഇത് പഠിക്കേണ്ടത് എന്തുകൊണ്ട്? SEBI-യുടെ പുതിയ F&O നിയമങ്ങൾ indicators-നെ ആശ്രയിക്കുന്ന traders-നു ബുദ്ധിമുട്ടുണ്ടാക്കിയിരിക്കുന്നു. Price action traders ഈ മാറ്റങ്ങൾ വേഗം adapt ചെയ്തു, കാരണം അവർ market-നെ നേരിട്ട് മനസ്സിലാക്കാൻ പഠിച്ചിരിക്കുന്നു.
Mentor-ന്റെ guidance ആവശ്യമുണ്ടോ? WhatsApp: +91 7382177772
Frequently Asked Questions — Price Action Trading 2026
Can a complete beginner learn price action trading in India in 2026?
Yes — in fact, price action is the best starting point for beginners because it teaches you to understand the market rather than follow mechanical signals. Start with structure and support and resistance before moving to candlestick patterns. Expect 3–6 months of consistent practice before real proficiency develops.
Is price action trading suitable for Nifty options trading?
Absolutely. Price action gives you the directional bias and entry timing for options trades. Identify a price action setup on the Nifty 15-minute or 1-hour chart, then buy a CE (Call) or PE (Put) accordingly. Always account for Implied Volatility and theta decay when selecting strikes and expiries.
How is price action trading different from technical analysis?
Technical analysis is the broad field — it includes indicators, chart patterns, volume analysis, and price action. Price action is a subset of technical analysis that focuses exclusively on pure price behavior, rejecting lagging indicators in favor of direct market reading.
Does price action work in the Indian market specifically?
Yes — and arguably better than in many global markets. Indian indices have well-respected key levels at round numbers and strong institutional participation that creates textbook price action setups repeatedly throughout the trading week.
What is the best timeframe for price action trading on Nifty?
For intraday, the 15-minute chart is the most popular and effective. For swing trading, the daily chart. Always confirm the higher timeframe trend before taking setups on the lower timeframe — use the 1-hour chart for intraday confirmation and the weekly chart for swing trade confirmation.
Price action trading ke liye best broker kaun sa hai India mein?
Zerodha, Upstox, aur Angel One — teeno mein clean candlestick charts available hain. TradingView ke saath integrate karke aap best price action charts dekh sakte hain. Broker selection mein brokerage charges aur platform stability dekhein.
Does price action trading work for UK and Australia markets too?
Yes — price action principles are universal. FTSE 100 in the UK, ASX 200 in Australia, and the S&P 500 in the US all respond to the same price action setups. Session timing and key levels differ, but the underlying principles are identical across every liquid market in the world.
How long does it take to become consistently profitable with price action?
Most traders who study seriously and maintain a trading journal see consistent results in 6–18 months. The biggest variable is not intelligence — it is discipline. Traders who journal every trade and review their performance weekly improve three to four times faster than those who do not.
Real Results: How Amuktha Traders Apply Price Action in 2026
Over the past decade, traders coached by Amuktha Trading have applied these price action principles across Nifty 50 and Bank Nifty intraday trading, NSE midcap stock swing trading, MCX gold and crude oil futures, forex trading including USD/INR and EUR/USD, and US market analysis across the Dow Jones and S&P 500.
The consistent feedback across all these traders is the same: fewer trades, higher quality, better discipline. Price action removes the noise and forces you to wait for only the highest-probability setups — which, counterintuitively, is what produces the best long-term results.
"I reduced my trades from 15 per day to 3–4, and my profitability tripled in 4 months." — Amuktha student, Hyderabad
"The morning pullback setup on Bank Nifty alone paid for my entire year of coaching." — Amuktha student, Bangalore
"I now trade US markets with the same price action principles I learned for Nifty. The market language is identical." — Amuktha student, NRI in Dubai
Why Choose Amuktha Trading for Price Action Coaching?
Founded in 2013 and based in Hyderabad, Amuktha Trading and Investments has coached traders across India and globally in price action-based trading for over a decade.
The mentorship is one-on-one and personalized — not a generic recorded course you watch alone. You get real-time chart reviews on your actual charts with your actual trades. The coaching covers multiple markets — Nifty, Bank Nifty, stocks, forex, and global indices. It is available in English, Hindi, Telugu, and Malayalam so the language of learning is never a barrier. And it is results-focused, with accountability, journaling support, and weekly performance reviews built into every program.
Ready to go from confusion to consistent trading?
WhatsApp: +91 7382177772 Website: amuktha.com Location: Hyderabad, India — serving traders globally since 2013
Closing: Master the Language of the Market in 2026
Price action trading is not a shortcut — it is the foundation. Every great trader, from Al Brooks to institutional fund managers, ultimately reads the market through the lens of price: where did it go, where did it stop, where did it reverse, and who is in control?
In 2026, with Indian markets maturing rapidly and global connectivity making cross-market trading accessible to every retail trader, this skill has never been more valuable. Whether you are a student in Hyderabad learning to trade Nifty, a professional in Dubai watching the Dow Jones, or a swing trader in London analyzing FTSE 100 stocks — price action is the universal language of the market.
Start with structure. Add levels. Confirm with patterns. Manage your risk. Journal every trade.
And if you want to accelerate that journey with expert guidance, the mentor at Amuktha is one WhatsApp message away.
+91 7382177772 — WhatsApp today for a free chart review.
Disclaimer:- Trading in securities markets carries substantial risk and is not suitable for everyone. Past performance is not indicative of future results. This article is for educational purposes only and should not be construed as investment advice. Please conduct your own research and consult a SEBI-registered financial advisor before making trading or investment decisions.
© 2026 Amuktha Trading. Telangana, India. Serving global traders since 2013.