7 Proven Trading Setups That Professional Traders Use Daily
What Are Trading Setups and Why Do They Matter?
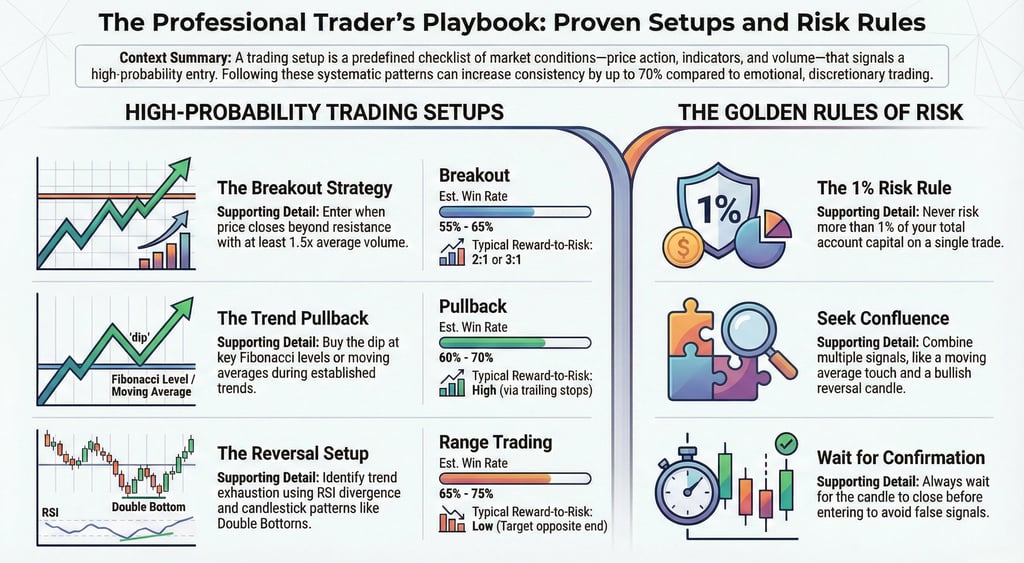
A trading setup is a predefined set of conditions that must occur before you enter a trade. Think of it as your trading checklist—a specific combination of price action, indicators, and market context that signals a high-probability trading opportunity.
Without consistent trading setups, you're essentially gambling. With them, you're following a systematic approach that can be tested, refined, and improved over time.
In this comprehensive guide, you'll learn the seven most reliable trading setups used by professional traders, complete with entry rules, exit strategies, and real-world examples. Whether you're a day trader, swing trader, or position trader, these setups will form the foundation of your trading strategy.
Why Trading Setups Are Essential for Consistent Profits
Before diving into specific setups, let's understand why they're crucial:
Consistency and Discipline: Trading setups remove emotional decision-making. When your predefined conditions are met, you trade. When they're not, you wait.
Risk Management: Every setup comes with clear stop-loss levels, helping you define your risk before entering a trade.
Measurable Results: With documented setups, you can track which ones work best for your trading style and market conditions.
Pattern Recognition: Over time, you'll spot these setups faster, improving your execution and timing.
According to a study of professional traders, those who follow systematic setups have a 60-70% higher consistency rate compared to discretionary traders who trade based on gut feeling.
The 7 Most Effective Trading Setups
1. Breakout Setup: Capturing Explosive Moves
What It Is: A breakout occurs when price moves beyond a defined support or resistance level with increased volume, signaling the start of a new trend.
When to Use It:
During range-bound markets transitioning to trends
After consolidation periods
At key psychological price levels
Entry Rules:
Wait for a candle to close beyond the resistance/support level
Confirm with volume spike (at least 1.5x average volume)
Enter on the retest of the broken level or immediately on breakout
Stop Loss Placement:
Below the breakout level for long trades
Above the breakout level for short trades
Typically 1-2% below/above the level
Take Profit Strategy:
Measure the height of the consolidation range and project it from the breakout point
Use a 2:1 or 3:1 reward-to-risk ratio
Trail your stop as the move progresses
Example: If a stock consolidates between $50-$52 for several weeks, a breakout above $52 with strong volume could target $54 (the $2 range projected upward).
Common Mistakes to Avoid:
Trading false breakouts (wait for volume confirmation)
Entering too late after extended moves
Ignoring overall market context
Success Rate: When properly executed with volume confirmation, breakout setups have approximately 55-65% win rates.
2. Pullback Setup: Trading With the Trend
What It Is: A pullback setup involves entering a trending market when prices temporarily move against the prevailing trend, offering a better entry price.
When to Use It:
In established uptrends or downtrends
After strong directional moves
At support/resistance zones within the trend
Entry Rules:
Identify a clear trend (price above 20 and 50-period moving averages for uptrends)
Wait for a pullback to a key support level (previous resistance, Fibonacci retracement, or moving average)
Look for reversal signals (bullish engulfing, hammer candle, or momentum divergence)
Enter when price shows strength resuming the trend
Stop Loss Placement:
Below the pullback low for long trades
Above the pullback high for short trades
Beyond the support/resistance zone
Take Profit Strategy:
Target previous swing highs/lows
Use trailing stops to capture extended moves
Exit partial positions at resistance levels
Example: In an uptrend, a stock moves from $60 to $70, then pulls back to $66 (the 50% Fibonacci retracement). A bullish reversal candle at $66 offers a low-risk entry with a stop at $64.
Fibonacci Retracement Levels to Watch:
38.2% retracement: Shallow pullback in strong trends
50% retracement: Most common pullback level
61.8% retracement: Deep pullback, trend may be weakening
Common Mistakes to Avoid:
Catching a falling knife in a trend reversal
Not confirming the pullback has ended
Entering too early before price stabilizes
Success Rate: Pullback setups in strong trends have 60-70% win rates with proper confirmation.
3. Reversal Setup: Catching Trend Changes
What It Is: A reversal setup identifies when an existing trend is exhausting and about to change direction, allowing you to profit from the new trend early.
When to Use It:
At major support/resistance zones
After extended moves with momentum divergence
When multiple reversal signals align
Entry Rules:
Identify overextended trends (RSI above 70 for downside reversals, below 30 for upside reversals)
Look for divergence between price and momentum indicators
Wait for reversal candlestick patterns (double top/bottom, head and shoulders, evening/morning star)
Enter on confirmation candle that breaks the pattern neckline
Stop Loss Placement:
Beyond the reversal pattern's extreme point
Typically 2-3% beyond the swing high/low
Take Profit Strategy:
Target the measured move from the pattern
Previous support becomes resistance (and vice versa)
Use a 2:1 minimum risk-reward ratio
Key Reversal Indicators:
RSI Divergence: Price makes new highs but RSI doesn't
MACD Crossover: Signal line crosses the MACD line
Volume: Decreasing volume on the final leg suggests exhaustion
Example: A stock in a downtrend reaches $40 with RSI at 25. It forms a double bottom at $40, with the second bottom showing bullish divergence on RSI. When price breaks above $42 (the neckline), you enter long with a stop at $39.
Common Mistakes to Avoid:
Trying to pick tops and bottoms without confirmation
Ignoring the bigger trend context
Entering on the first reversal signal (wait for confirmation)
Success Rate: Reversal setups are more challenging, with 45-55% win rates, but often offer larger reward-to-risk ratios (3:1 or better).
4. Range Trading Setup: Profiting from Consolidation
What It Is: Trading within a defined range by buying at support and selling at resistance when markets are moving sideways.
When to Use It:
During low volatility periods
In choppy, non-trending markets
Between major news events
Entry Rules:
Identify clear support and resistance levels tested at least 3 times
Enter near support for long trades with reversal confirmation
Enter near resistance for short trades with rejection signals
Ensure the range is wide enough to justify the risk (minimum 3-4% range)
Stop Loss Placement:
Just beyond the support/resistance level (1-2% buffer)
Take Profit Strategy:
Target the opposite end of the range
Exit before reaching the exact level to improve fill rates
Range Identification Tips:
Use pivot points or previous swing highs/lows
Look for horizontal consolidation on daily charts
Confirm with low ADX readings (below 25 indicates no trend)
Common Mistakes to Avoid:
Trading ranges that are too tight
Staying in trades when range breaks down
Not recognizing when the range is ending
Success Rate: Range trading setups in proper conditions have 65-75% win rates but smaller reward-to-risk ratios.
5. Moving Average Crossover Setup: Simple Yet Effective
What It Is: A trend-following setup based on the crossover of two moving averages, signaling potential trend changes.
Popular Combinations:
50-day and 200-day (Golden Cross/Death Cross)
9-day and 21-day (short-term traders)
20-day and 50-day (swing traders)
Entry Rules:
Enter when the faster moving average crosses above the slower one (bullish)
Enter when the faster moving average crosses below the slower one (bearish)
Confirm with price above/below both moving averages
Ensure crossing occurs with momentum (not during choppy sideways action)
Stop Loss Placement:
Below the slower moving average
Use the recent swing low/high
Take Profit Strategy:
Exit when moving averages cross in opposite direction
Use trailing stops based on the faster moving average
Take partial profits at key resistance levels
Common Mistakes to Avoid:
Trading in choppy markets (crossovers generate false signals)
Not waiting for confirmed crosses
Using in low-volatility conditions
Success Rate: Moving average crossovers work best in trending markets with 50-60% win rates.
6. Gap Trading Setup: Exploiting Price Inefficiencies
What It Is: A gap occurs when a security opens significantly higher or lower than its previous close, creating an empty space on the chart.
Types of Gaps:
Breakaway Gap: Occurs at the start of new trends (trade in gap direction)
Continuation Gap: Mid-trend gaps (trade in gap direction)
Exhaustion Gap: Near trend end (trade gap-fill direction)
Entry Rules for Gap Fill:
Identify the gap on the opening
Wait for initial momentum to slow
Enter when price starts moving back toward the gap
Use the gap's midpoint as a first target
Entry Rules for Gap Extension:
Strong gap with high volume suggests continuation
Enter on first pullback after gap
Place stop below/above the gap range
Stop Loss Placement:
For gap fills: beyond the extreme of the opening range
For gap continuations: below/above the gap itself
Common Mistakes to Avoid:
Assuming all gaps will fill (they don't)
Trading gaps in low-volume conditions
Not considering the gap type
Success Rate: Gap strategies require experience but can achieve 55-65% win rates with proper classification.
7. Support and Resistance Bounce Setup: Trading Key Levels
What It Is: Entering trades at established support or resistance levels where price is likely to reverse.
When to Use It:
At previously tested horizontal levels
At round psychological numbers ($50, $100, etc.)
At pivot points from previous periods
Entry Rules:
Identify strong support/resistance (tested 3+ times)
Wait for price to reach the level
Look for reversal candlestick patterns (pin bars, engulfing patterns)
Enter on confirmation of the bounce
Stop Loss Placement:
Just beyond the support/resistance level
Use the length of the reversal candle to determine placement
Take Profit Strategy:
Target the next significant level
Use a minimum 2:1 reward-to-risk ratio
Scale out at multiple targets
How to Identify Strong Levels:
More touches = stronger level
Levels from higher timeframes are more significant
Volume spikes at the level add strength
Common Mistakes to Avoid:
Not waiting for confirmation before entering
Trading weak levels with only 1-2 touches
Ignoring the overall trend direction
Success Rate: Well-established support/resistance levels have 60-70% bounce rates.
How to Choose the Right Trading Setup for Your Style
Not every trading setup suits every trader. Here's how to match setups with your trading approach:
Day Traders:
Focus on breakout and range trading setups
Use shorter timeframes (5-min, 15-min charts)
Prioritize volume and momentum
Swing Traders:
Pullback and moving average crossover setups work best
Use daily and 4-hour charts
Hold positions for days to weeks
Position Traders:
Reversal and support/resistance setups on weekly charts
Focus on major trend changes
Hold positions for weeks to months
Risk Tolerance Considerations:
Conservative: Range trading, pullbacks in trends
Moderate: Support/resistance bounces, moving average crossovers
Aggressive: Breakouts, reversals, gap trading
Combining Multiple Setups for Higher Probability Trades
The most successful traders don't rely on a single setup. They look for confluence—when multiple setups align:
Example of Confluence: A stock pulls back to its 50-day moving average (pullback setup), which coincides with a previous resistance-turned-support level (support/resistance setup), and shows bullish divergence on the RSI (reversal indicator). This triple confluence significantly increases the probability of success.
Checklist for High-Probability Setups:
✓ Setup aligns with higher timeframe trend
✓ Volume confirms the setup
✓ Multiple indicators support the trade
✓ Clear risk-reward ratio of at least 2:1
✓ No major news events pending
Risk Management: The Key to Long-Term Success
Even the best trading setups fail sometimes. Proper risk management ensures you survive losing streaks:
Position Sizing Rules:
Never risk more than 1-2% of your account on a single trade
Reduce position size when trading lower-probability setups
Increase position size (slightly) when multiple setups align
Stop Loss Discipline:
Always set a stop loss before entering a trade
Never move your stop loss to increase risk
Accept the loss when your stop is hit
The 1% Rule: If your account is $10,000 and you risk 1% per trade ($100), a losing streak of 10 trades only costs you $1,000—you're still in the game with $9,000 to recover.
Common Trading Setup Mistakes and How to Avoid Them
Mistake 1: Forcing Trades Solution: Wait patiently for your setup criteria to be met. No setup = no trade.
Mistake 2: Ignoring Market Context Solution: Always check the broader market trend, news calendar, and volatility conditions.
Mistake 3: Overcomplicating Your Strategy Solution: Master 2-3 setups thoroughly rather than trying to trade everything.
Mistake 4: Not Backtesting Solution: Test your setups on historical data to understand their win rates and typical behavior.
Mistake 5: Poor Trade Documentation Solution: Keep a trading journal tracking every trade, setup used, outcome, and lessons learned.
Tools and Resources for Identifying Trading Setups
Charting Platforms:
TradingView: Excellent for technical analysis and multiple timeframes
Thinkorswim: Advanced scanning and analysis tools
MetaTrader: Popular for forex and automated trading
Essential Indicators:
Moving Averages (20, 50, 200-period)
RSI (Relative Strength Index)
MACD (Moving Average Convergence Divergence)
Volume
Fibonacci Retracement tools
Screening for Setups: Most platforms allow you to create custom scans. For example:
Scan for stocks breaking 52-week highs with volume > 2x average
Find stocks pulling back to their 50-day MA in uptrends
Identify stocks with RSI < 30 at major support levels
Educational Resources:
"Technical Analysis of the Financial Markets" by John Murphy
"Trading in the Zone" by Mark Douglas
Online trading communities (be selective and verify information)
Frequently Asked Questions (FAQ)
Q: How long does it take to master trading setups?
A: Most traders need 6-12 months of consistent practice and backtesting to become proficient with 2-3 core setups. Mastery is an ongoing process that continues throughout your trading career.
Q: Can I use the same setup for stocks, forex, and crypto?
A: Yes, these setups work across all markets. However, each market has unique characteristics. Crypto is more volatile, forex responds to different catalysts, and stocks are influenced by earnings and company news.
Q: What's the best timeframe for trading setups?
A: It depends on your trading style. Day traders use 5-min to 1-hour charts. Swing traders focus on 4-hour to daily charts. Position traders analyze daily and weekly charts. Higher timeframes generally produce more reliable signals.
Q: How many setups should I trade?
A: Start with one or two setups and master them completely. As you gain experience, you can add more. Most professional traders use 3-5 core setups.
Q: What's a good win rate for trading setups?
A: A 55-60% win rate is excellent when combined with proper risk-reward ratios. Even 45-50% win rates can be profitable if your winners are twice the size of your losers.
Q: Should I always wait for perfect setups?
A: Yes. Patience is one of the most valuable traits in trading. It's better to miss a trade than to force one that doesn't meet your criteria.
Q: How do I know if my setup is working?
A: Track at least 50-100 trades using the setup. Calculate your win rate, average win, average loss, and overall profitability. This data tells you if the setup works for you.
Q: Can trading setups work in bear markets?
A: Absolutely. Setups like breakouts, pullbacks, and reversals work in both bull and bear markets. You simply adjust your direction (more short setups in bear markets).
Taking Your Trading to the Next Level
Now that you understand these seven proven trading setups, the next step is implementation:
Week 1-2: Education Phase
Study each setup in detail
Watch historical charts to identify examples
Create a checklist for each setup
Week 3-4: Paper Trading
Practice identifying setups in real-time without real money
Document each trade as if it were real
Review your decisions at the end of each day
Month 2-3: Small Position Trading
Start with minimal risk (0.5% per trade)
Trade only your highest-conviction setups
Focus on perfect execution, not profits
Month 4+: Scaling Up
Gradually increase position sizes as consistency improves
Refine your best-performing setups
Continue learning and adapting
Building Your Trading Plan: A complete trading plan should include:
Your chosen setups with specific entry/exit rules
Risk management parameters
Trading schedule and markets you'll focus on
Performance goals and review schedule
Psychological preparation and routines
Your Path to Consistent Trading Success
Trading setups are the foundation of professional trading. They transform random market guesses into systematic, testable strategies that can be refined over time.
The seven setups covered in this guide—breakouts, pullbacks, reversals, range trading, moving average crossovers, gap trading, and support/resistance bounces—have been proven by thousands of successful traders across decades of market history.
Remember these key principles:
Master one or two setups before adding more
Always use proper risk management
Be patient and wait for quality setups
Document and review every trade
Continuously learn and adapt
Trading is a skill that improves with deliberate practice. Start small, be consistent, and focus on the process rather than immediate profits. Over time, these setups will become second nature, and you'll develop the pattern recognition that separates successful traders from the rest.
Ready to Apply These Setups?
If you're looking for a platform that helps you identify these setups in real-time with expert analysis and guidance, Amuktha provides:
Daily market scans highlighting active setups
Real-time alerts when high-probability setups form
Educational resources to deepen your understanding
A community of traders sharing insights and experiences
Whether you choose to trade independently or with support, the key is to start applying what you've learned. Open your charts, identify your first setup, and begin your journey toward consistent trading success.
Disclaimer:- Trading in securities markets carries substantial risk and is not suitable for everyone. Past performance is not indicative of future results. This article is for educational purposes only and should not be construed as investment advice. Please conduct your own research and consult a SEBI-registered financial advisor before making trading or investment decisions.
© 2026 Amuktha Trading. Telangana, India. Serving global traders since 2013.