Stock Market Indices Explained: Complete Guide to Nifty 50, S&P 500 & 12 Global Indices (2026)
Last Updated: January 22, 2026
Table of Contents
What Are Stock Market Indices?
Why Indices Matter for Traders
How Stock Indices Are Calculated
12 Major Global Indices Explained
How to Trade Using Indices
Index Funds vs. Individual Stocks
Common Mistakes to Avoid
Frequently Asked Questions
What Are Stock Market Indices? {#what-are-indices}
A stock market index is a carefully selected basket of stocks that measures the performance of a specific market segment, industry sector, or entire economy. Think of it as a barometer for market health—when the Nifty 50 rises by 2%, it tells you that India's top 50 companies collectively gained value that day.
For traders and investors worldwide, indices serve three critical purposes: they benchmark portfolio performance, signal economic trends, and provide diversified investment opportunities through index funds and ETFs.
Real-World Example
Imagine you invested ₹100,000 in Indian stocks last year. To know if you did well, you'd compare your returns against the Nifty 50. If the Nifty gained 15% but your portfolio only grew 8%, you underperformed the market. This comparison helps you evaluate whether active stock picking beats passive index investing.
Why Stock Market Indices Matter for Traders and Investors {#why-indices-matter}
1. Performance Benchmarking
Indices provide the standard against which all investment strategies are measured. Professional fund managers are often evaluated based on whether they can beat indices like the S&P 500 or Nifty 50. For individual traders, comparing your annual returns to these benchmarks reveals whether your strategy delivers value or if you'd be better off with simple index investing.
2. Economic Health Indicators
When the DAX 40 surges, it typically signals strength in Germany's manufacturing and export sectors. Conversely, a declining Shanghai Composite might indicate slowdowns in Chinese consumer spending or industrial production. Central banks, policymakers, and economists monitor these indices daily to gauge economic momentum and make informed decisions.
As of January 2026, major indices are reflecting global economic recovery patterns, with technology-heavy indices like NASDAQ showing particular strength due to AI sector growth.
3. Foundation for Investment Products
Exchange-Traded Funds (ETFs) and mutual funds worth trillions of dollars track major indices. When you invest in an S&P 500 ETF, you're buying a proportional stake in all 500 companies, achieving instant diversification. This approach has gained massive popularity because it offers broad market exposure with lower fees than actively managed funds.
4. Market Sentiment Gauge
Indices reflect collective investor psychology. During bull markets, rising indices indicate optimism about future corporate earnings and economic growth. Bear markets, marked by falling indices, reveal fear and uncertainty. Understanding this sentiment helps traders anticipate volatility and position themselves accordingly.
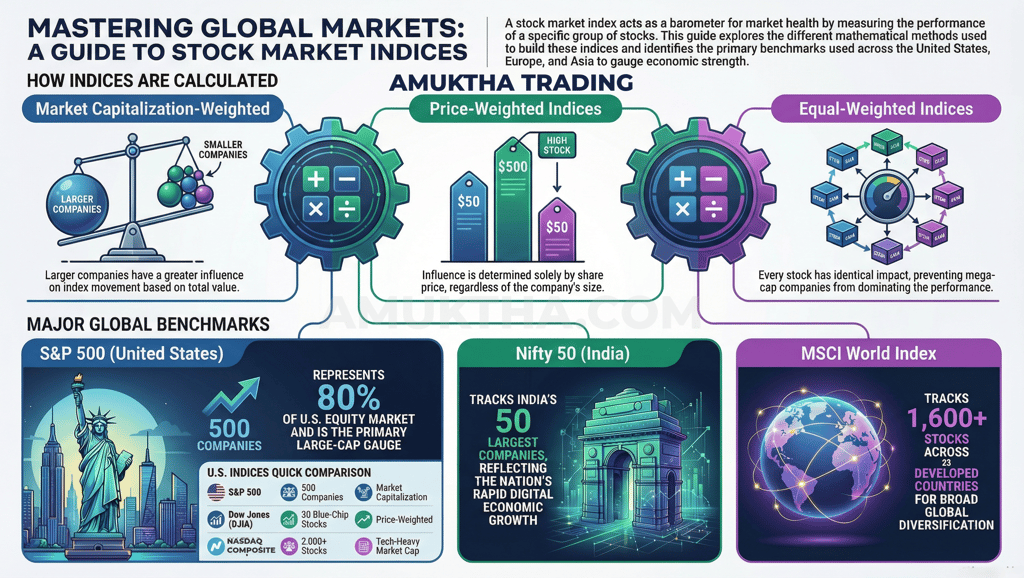
How Stock Market Indices Are Calculated: 3 Key Methods {#calculation-methods}
Not all indices are created equal. The calculation method dramatically affects which stocks influence the index most.
Price-Weighted Indices
Examples: Dow Jones Industrial Average, Nikkei 225
In price-weighted indices, stocks with higher share prices have greater influence regardless of company size. If a ₹5,000 stock moves 1%, it impacts the index more than a ₹500 stock moving 1%.
Limitation: This method can be misleading. A stock's price doesn't necessarily reflect company importance—a ₹100 billion company with a ₹200 share price matters less than a ₹10 billion company with a ₹2,000 share price.
Market Capitalization-Weighted Indices
Examples: S&P 500, Nifty 50, FTSE 100, NASDAQ Composite
These indices weight companies by total market value (share price × shares outstanding). A ₹10 trillion company like Apple influences the index ten times more than a ₹1 trillion company. This reflects economic reality—larger companies genuinely have bigger impacts on markets and economies.
Advantage: This method naturally captures which companies drive market movements and economic growth.
Equal-Weighted Indices
Examples: S&P 500 Equal Weight Index
Every stock gets identical weighting regardless of size or price. A small pharmaceutical company has the same influence as tech giants.
Advantage: Prevents mega-cap stocks from dominating. Provides better exposure to mid-cap and small-cap opportunities.
Understanding these differences helps you interpret index movements correctly. When NASDAQ rises 2%, it's largely driven by mega-cap tech stocks. When an equal-weighted index rises 2%, it represents broader market strength.
12 Major Global Stock Market Indices Every Trader Should Know {#global-indices}
United States Indices
1. S&P 500 (Standard & Poor's 500)
Coverage: 500 largest U.S. publicly traded companies
Market Cap Represented: Approximately 80% of total U.S. equity market
Key Sectors: Technology (29%), Healthcare (13%), Financials (12%)
Why It Matters: Considered the best single gauge of large-cap U.S. equities
The S&P 500 includes household names like Apple, Microsoft, Amazon, Alphabet (Google), and NVIDIA. As of January 2026, the index reflects strong performance in artificial intelligence and cloud computing sectors, with technology stocks continuing their multi-year dominance.
Trading Tip: S&P 500 ETFs like SPY and VOO are among the world's most liquid securities, making them ideal for both long-term investors and short-term traders.
2. Dow Jones Industrial Average (DJIA)
Coverage: 30 blue-chip U.S. stocks
Calculation: Price-weighted
Why It Matters: Oldest continuously calculated index (since 1896), widely quoted in financial media
Despite tracking just 30 companies, the Dow remains culturally significant. Companies include Boeing, Goldman Sachs, McDonald's, and Visa. The index provides insight into traditional American industrial and financial strength.
Limitation: Price-weighting and limited scope make it less representative than the S&P 500 for portfolio benchmarking.
3. NASDAQ Composite
Coverage: Over 3,000 stocks listed on NASDAQ exchange
Tech Weighting: Approximately 55% technology stocks
Why It Matters: Primary benchmark for growth and technology investing
NASDAQ's heavy tech concentration makes it more volatile but potentially more rewarding during technology bull markets. Major components include Apple, Microsoft, Amazon, Tesla, and Meta. As of early 2026, artificial intelligence developments continue driving significant NASDAQ movements.
Trading Strategy: Use NASDAQ as a leading indicator—tech stocks often move before broader markets during both rallies and corrections.
European Indices
4. FTSE 100 (Financial Times Stock Exchange)
Coverage: 100 largest companies on London Stock Exchange
Unique Feature: 70% of revenues come from outside the UK
Major Holdings: Shell, AstraZeneca, HSBC, Unilever, BP
The FTSE 100 offers exposure to international conglomerates headquartered in Britain. Its performance often correlates more with global commodity prices and emerging market growth than UK domestic economy.
Currency Factor: Many FTSE companies report in dollars or euros, making sterling exchange rates crucial to index performance.
5. DAX 40 (Deutscher Aktienindex)
Coverage: 40 major German companies
Economic Significance: Represents Europe's largest economy
Key Companies: Volkswagen, Siemens, SAP, Allianz, BMW
Germany's manufacturing prowess means DAX performance closely tracks European industrial health and global trade volumes. Strong DAX performance typically signals robust export demand and manufacturing activity.
2026 Context: The index reflects Germany's transition toward renewable energy and electric vehicles, with traditional automakers facing both challenges and opportunities.
6. CAC 40 (Cotation Assistée en Continu)
Coverage: 40 largest French stocks
Major Sectors: Luxury goods, energy, pharmaceuticals
Notable Companies: LVMH, L'Oréal, TotalEnergies, Sanofi
France's luxury goods sector gives CAC 40 unique characteristics. LVMH alone represents significant index weighting, making Chinese consumer demand a key driver.
Asian Indices
7. Nikkei 225
Coverage: 225 top Japanese companies
Calculation: Price-weighted
Major Holdings: Toyota, Sony, SoftBank, Fast Retailing (Uniqlo)
Japan's benchmark reflects the nation's technological innovation and export-oriented economy. The Nikkei provides exposure to robotics, automotive, electronics, and gaming industries.
Historical Note: Despite being Asia's most established index, the Nikkei remains below its 1989 peak, illustrating Japan's unique economic challenges.
8. Hang Seng Index
Coverage: 50 largest Hong Kong-listed companies
Sector Mix: Finance (28%), Real Estate (9%), Technology (27%)
Why It Matters: Gateway to Chinese equity markets
Many mainland Chinese companies list in Hong Kong, making the Hang Seng crucial for China exposure. Tencent, Alibaba (when listed), and major Chinese banks significantly influence this index.
Political Factor: Hong Kong's status as international financial center makes this index sensitive to China-West relations and regulatory changes.
9. Shanghai Composite
Coverage: All stocks on Shanghai Stock Exchange (1,800+ companies)
Accessibility: Partially restricted to foreign investors
Why It Matters: Direct measure of Chinese domestic market sentiment
Unlike the Hang Seng, the Shanghai Composite reflects stocks primarily owned and traded by mainland Chinese investors. This makes it a purer gauge of Chinese domestic economic confidence.
Volatility Warning: Chinese retail investor behavior can create dramatic swings unrelated to fundamental economics.
10. Nifty 50 (National Stock Exchange Fifty)
Coverage: 50 largest Indian companies
Sectors: Finance (37%), IT (16%), Energy (12%)
Major Holdings: Reliance Industries, TCS, HDFC Bank, Infosys, ICICI Bank
India's primary benchmark reflects the nation's rapid economic growth and demographic advantages. The Nifty 50 provides exposure to India's digital transformation, infrastructure development, and emerging middle-class consumption.
Trading Volume: Nifty derivatives are among the world's most actively traded contracts, offering excellent liquidity for traders.
Other Key Global Indices
11. ASX 200 (Australian Securities Exchange)
Coverage: 200 largest Australian companies
Key Sectors: Financials (30%), Materials/Mining (20%)
Major Companies: BHP Group, Commonwealth Bank, CSL, Rio Tinto
Australia's resource-rich economy makes the ASX 200 sensitive to commodity prices, particularly iron ore and coal. Chinese industrial demand significantly influences this index.
Dividend Feature: Australian stocks traditionally offer high dividend yields, making the ASX 200 attractive for income investors.
12. MSCI World Index
Coverage: 1,600+ stocks from 23 developed countries
Geographic Mix: USA (70%), Japan (6%), UK (4%)
Why It Matters: True global diversification benchmark
The MSCI World represents the broadest developed-market exposure available in a single index. Institutional investors use it as the ultimate benchmark for global equity allocation.
Emerging Markets Note: This index excludes developing nations—for complete global exposure, investors combine it with MSCI Emerging Markets Index.
How to Trade Using Stock Market Indices: Proven Strategies {#trading-strategies}
Strategy 1: Trend Following
Identify whether major indices are in uptrends (higher highs and higher lows) or downtrends. When the Nifty 50 breaks above its 200-day moving average, technical traders often increase long positions. When it falls below, they reduce exposure or take short positions.
Example: If NASDAQ consistently makes new highs while showing relative strength against S&P 500, focus trading capital on technology stocks rather than defensive sectors.
Strategy 2: Index ETF Investing
Rather than picking individual stocks, invest in ETFs that replicate indices:
SPY or VOO → S&P 500 exposure
QQQ → NASDAQ-100 tracking
NIFTYBEES → Nifty 50 in India
EWJ → Japan (Nikkei) exposure
This approach offers instant diversification, lower fees, and eliminates individual stock risk.
Strategy 3: Pairs Trading
Exploit relative performance between indices. If you believe European stocks will outperform American stocks, you might:
Long DAX 40 ETF
Short S&P 500 ETF
This market-neutral strategy profits from relative movement regardless of overall market direction.
Strategy 4: Hedging Portfolio Risk
If you hold significant individual stock positions, hedge downside risk by purchasing put options on relevant indices or shorting index futures. When your stocks decline, index shorts provide offsetting gains.
Example: An Indian investor holding ₹50 lakh in individual stocks might buy Nifty put options worth ₹5 lakh as insurance against market crashes.
Strategy 5: Sector Rotation
Different sectors lead during different economic cycles. By monitoring sector-specific indices, you can rotate capital:
Early recovery: Financials, Industrials
Mid-cycle: Technology, Consumer Discretionary
Late cycle: Energy, Materials
Recession: Healthcare, Consumer Staples, Utilities
Track sector indices within broader benchmarks to time these rotations effectively.
Index Funds vs. Individual Stock Picking: What Works Better? {#index-funds}
The Case for Index Investing
Research consistently shows that 80-90% of actively managed funds underperform their benchmark indices over 10+ year periods. Warren Buffett famously won a decade-long bet proving this point. For most investors, low-cost index funds deliver superior long-term returns because:
Lower fees (0.03-0.20% vs. 1-2% for active funds)
Tax efficiency (less frequent trading)
No manager risk (removes human error)
Guaranteed market returns (you get what the market delivers)
When Individual Stock Picking Makes Sense
Despite index advantages, stock picking can outperform if you:
Possess genuine expertise in specific industries
Have access to superior research or information
Can emotionally handle volatility and individual stock risk
Dedicate significant time to analysis
Focus on inefficient markets where mispricings exist
Hybrid Approach
Many successful investors use 70-80% index funds for core holdings, reserving 20-30% for individual stock opportunities. This balances market-matching returns with potential outperformance while limiting downside risk.
Common Index Trading Mistakes to Avoid {#mistakes}
Mistake 1: Ignoring Index Composition Changes
Indices periodically rebalance, adding high-performing stocks and removing weak ones. This creates short-term price pressure. When Tesla joined the S&P 500, index funds purchased billions in shares, temporarily inflating prices.
Solution: Monitor rebalancing announcements and consider front-running obvious additions or avoiding recent deletions.
Mistake 2: Overlooking Currency Effects
International index returns depend heavily on exchange rates. A 10% gain in the Nikkei 225 might become a 5% loss for U.S. investors if the yen weakens 15% against the dollar.
Solution: Consider currency-hedged ETFs for international exposure or factor forex movements into return expectations.
Mistake 3: Chasing Recent Performance
Indices that surged 30% last year often revert toward mean returns. Chasing hot sectors or geographies typically leads to buying high and selling low.
Solution: Maintain consistent allocation across global indices, rebalancing annually to sell outperformers and buy underperformers.
Mistake 4: Panic Selling During Corrections
All indices experience 10-20% corrections every few years and 30-50% bear markets occasionally. Selling during panic crystallizes losses and misses subsequent recoveries.
Solution: Maintain 6-12 months emergency cash reserves so you never need to sell stocks during downturns. This emotional buffer prevents costly mistakes.
Mistake 5: Confusing Indices With The Economy
Indices often peak before recessions begin and bottom before recoveries start. They're forward-looking mechanisms, not real-time economic measures.
Solution: Use indices as sentiment indicators but supplement with economic data like employment, manufacturing PMIs, and consumer spending for complete pictures.
Frequently Asked Questions About Stock Market Indices {#faq}
What's the difference between Nifty 50 and Sensex?
Nifty 50 tracks 50 stocks on the National Stock Exchange, while Sensex tracks 30 stocks on the Bombay Stock Exchange. Nifty is more broadly diversified and has become the preferred benchmark for Indian equity market performance. Both are market-cap weighted and highly correlated.
Can I directly invest in an index?
No, indices are statistical measures, not investable securities. However, you can invest in index mutual funds or ETFs that replicate index performance with minimal tracking error. These funds buy the same stocks in the same proportions as the index.
Which index is best for beginners?
For Indian investors, Nifty 50 index funds or ETFs provide excellent starting points with broad domestic exposure. Global investors typically begin with S&P 500 funds. Both offer diversification, liquidity, and long-term growth potential with minimal complexity.
How often do indices change their components?
Most major indices review constituents quarterly or semi-annually, making changes as needed. However, significant changes are relatively rare—perhaps 5-10 stocks annually in a 50-stock index. Changes typically occur when companies grow too small, merge, delist, or when larger companies become eligible.
Do stock splits affect index values?
For market-cap weighted indices like the S&P 500 and Nifty 50, stock splits have zero impact because total market value remains unchanged. For price-weighted indices like the Dow Jones, splits require divisor adjustments to prevent artificial index changes.
Why does NASDAQ often move more than the S&P 500?
NASDAQ's heavy concentration in technology and growth stocks creates higher volatility. Tech companies typically have higher valuations (price-to-earnings ratios) and growth expectations, making them more sensitive to interest rate changes, economic forecasts, and investor sentiment shifts.
Are indices useful for day trading?
Absolutely. Index futures and options are among the most liquid instruments available, offering tight bid-ask spreads and deep order books. Nifty and Bank Nifty futures dominate Indian derivatives trading. S&P 500 futures (ES contracts) trade 24/5 globally with exceptional liquidity.
What happens to index funds when indices fall?
Index funds fall proportionally with their tracked indices. A 10% index decline typically produces a 10% fund decline (minus small tracking differences). This is a feature, not a bug—index funds give you pure market exposure, both up and down.
Start Using Stock Market Indices to Improve Your Trading Results
Understanding stock market indices transforms you from a reactive trader into a strategic investor. Whether you're tracking the Nifty 50 for Indian market exposure, monitoring the S&P 500 for U.S. economic health, or comparing DAX 40 against FTSE 100 for European opportunities, indices provide the framework for informed decision-making.
Remember these key takeaways:
Use indices as benchmarks to measure your investment performance honestly
Consider index funds as your core holdings for most efficient long-term wealth building
Monitor multiple global indices to identify opportunities and diversify geographic risk
Understand calculation methods to interpret index movements correctly
Track sector indices within broader benchmarks to time tactical allocation shifts
The most successful investors combine index-based core holdings with selective individual stock positions and global diversification. This balanced approach captures market returns while preserving opportunities for outperformance.
About Amuktha Trading: We provide comprehensive stock market education, technical analysis training, and trading mentorship to help Indian and global investors achieve their financial goals. Our courses cover everything from beginner fundamentals to advanced derivatives strategies.
Disclaimer:- Trading in securities markets carries substantial risk and is not suitable for everyone. Past performance is not indicative of future results. This article is for educational purposes only and should not be construed as investment advice. Please conduct your own research and consult a SEBI-registered financial advisor before making trading or investment decisions.
© 2026 Amuktha Trading. Telangana, India. Serving global traders since 2013.