7 Proven Intraday Trading Strategies for Nifty & Bank Nifty That Actually Work in 2026
By Amuktha Trading Academy · Updated March 2026 · 12 min read · India · US · UK · Australia
Most intraday traders in India lose money — not because they lack ambition, but because they trade without a tested system. Whether you are trading Nifty 50 futures, Bank Nifty options, or high-volume stocks on NSE, the strategies you use in 2026 need to account for higher market volatility, algorithmic participants, and the ever-present risk of false breakouts.
This guide walks you through 7 high-probability intraday trading strategies that working traders actually use — with specific setups, real Nifty examples, entry and exit rules, and the common mistakes that drain accounts. Whether you are a beginner in India or an experienced day trader in the US, UK, or Australia, every strategy here is actionable from day one.
This is not a surface-level overview. Each strategy includes the exact setup, when it works best, what indicators to use, risk-to-reward expectations, and a real trade example so you can paper trade it immediately.
What Is Intraday Trading — and Is It Right for You?
Intraday trading, also called day trading, means buying and selling a financial instrument — stocks, futures, options, forex, or CFDs — within the same trading session. All positions are closed before the market closes. There is no overnight risk, but you also cannot wait for a stock to recover if a trade goes wrong today.
Here are the key facts about intraday trading in India in 2026. NSE trading hours run from 9:15 AM to 3:30 PM IST, and all intraday positions must be squared off by 3:15 to 3:20 PM to avoid auto square-off charges. Brokers like Zerodha, Upstox, and Angel One offer up to 5x intraday margin, meaning ₹20,000 in your account can control ₹1,00,000 worth of stock. This amplifies both profits and losses equally. Short-term capital gains tax of 20% applies to intraday equity profits in India as of 2026, so factor this into your profit expectations from day one.
For global traders, US markets on NYSE and NASDAQ open at 9:30 AM ET, UK markets on the LSE open at 8:00 AM GMT, and Australian markets on the ASX open at 10:00 AM AEST. Studies consistently show that over 70% of retail intraday traders lose money. The strategies below are designed to put you in the profitable minority — but discipline is non-negotiable.
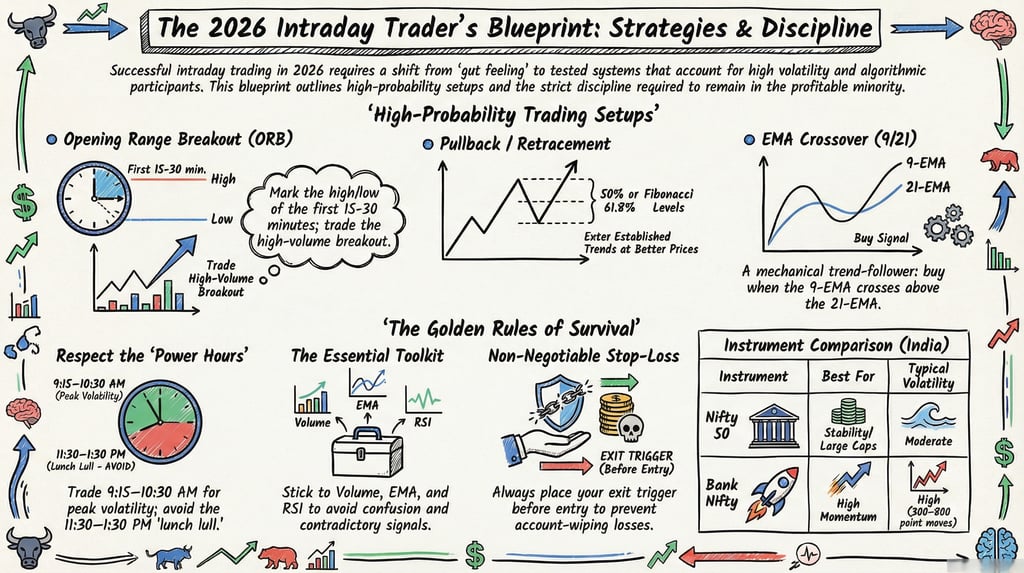
Strategy 1: Opening Range Breakout (ORB) — The Professional's First Trade
The ORB is one of the most widely used intraday strategies among professional traders globally — from institutional desks in Mumbai to prop trading firms in London and Chicago. It is built on a simple but powerful idea: the price range formed in the first 15 to 30 minutes of the trading session gives you the day's most important reference levels.
Best for: Nifty 50, Bank Nifty, large-cap stocks Timeframe: 15-minute or 30-minute chart Best trading window: 9:15 AM to 10:30 AM IST Minimum risk-to-reward: 1:2
How It Works
After the market opens at 9:15 AM IST, prices are chaotic as overnight orders get absorbed and institutional participants establish their positions. By 9:30 to 9:45 AM, a clear range usually forms. This range — the Opening Range High and the Opening Range Low — becomes the day's key reference. When price breaks above the Opening Range High with strong volume, it signals that buyers are in control and a trend move is likely. When it breaks below the Opening Range Low, sellers dominate. You trade in the direction of the breakout.
Step-by-Step Setup
Open a 15-minute chart of Bank Nifty or Nifty on Zerodha Kite, TradingView, or any charting platform. Mark the high and low of the first two candles, which cover 9:15 to 9:45 AM. This is your Opening Range. Draw horizontal lines at both levels and then wait. Do not trade during range formation — patience is the strategy itself.
For a buy signal, enter when a 15-minute candle closes above the Opening Range High with volume at least 1.5 times the average. Set your stop-loss at the Opening Range Low. Your target is the Opening Range High plus the size of the range itself — a minimum 1:1 range projection that you scale to at least 1:2.
For a sell signal, enter when a candle closes below the Opening Range Low with confirmation volume. Stop-loss sits at the Opening Range High, with the same target logic applied in reverse. Limit yourself to one ORB trade per session. Taking multiple ORB trades leads to overtrading and erodes the edge of the strategy.
Real Example — Bank Nifty, March 2026
Bank Nifty opens at 9:15 AM at 52,800. The first two candles form between 52,740 as the Opening Range Low and 52,980 as the Opening Range High — a range of 240 points. At 9:50 AM, a 15-minute candle closes at 53,040 with heavy volume. Entry is at 53,040. Stop-loss is at 52,740, which is 300 points of risk. The minimum target is 53,280, scaled to 53,520 for a 1:2 reward. The trade reaches 53,480 by 11:30 AM — a clean 440-point move.
Important Warning
Watch carefully for false breakouts. If the range is very narrow — under 80 to 100 Nifty points or 150 to 200 Bank Nifty points — skip the trade entirely. Narrow ranges produce the most false breakouts of any market condition. Also avoid ORB on days with no major global cues, as range-bound days kill this strategy completely.
For Global Traders
The ORB works excellently in US markets. Use the first 30-minute range on SPY, QQQ, or individual high-volume stocks. In the UK, apply the same logic to FTSE 100 CFDs after the 8:00 AM GMT open. In Australia, ORB on ASX 200 futures post 10:00 AM AEST is widely used by professional traders there.
Strategy 2: Momentum Trading — Ride What Is Already Moving
Momentum trading is the art of finding stocks or indices that are already moving strongly in one direction and joining that move. The logic is straightforward: strong buying pressure attracts more buyers, and strong selling pressure attracts more sellers. Your job is to identify momentum early and exit before it exhausts itself.
Best for: High-volume NSE stocks, Nifty 50 Timeframe: 5-minute or 15-minute chart Key indicators: RSI, MACD, Volume Risk-to-reward target: 1:2 to 1:3
How It Works
You are looking for stocks that show a sharp price move on above-average volume — either from the open or after a news catalyst. The key discipline is to enter on a small pullback after the initial burst, not by chasing the top of the move. Chasing momentum at the peak is how traders get trapped.
Scan for stocks up more than 2 to 3 percent, or down 2 to 3 percent, in the first 30 minutes with volume at least twice the 20-day average. Use NSE's pre-market data or TradingView screeners for this. Check RSI on the 5-minute chart — for a buy setup, RSI should be between 55 and 70, confirming momentum without being overbought. Above 70 means late-entry risk.
Wait for a small consolidation or minor pullback of one to two red candles in an uptrend, then enter when the next green candle breaks above the consolidation high. Set your stop-loss below the pullback low and target 2 to 3 times your risk. Trail your stop-loss once the trade moves in your favour, and exit immediately if RSI crosses above 75 or price shows a bearish engulfing candle on the 15-minute chart.
Real Example — Reliance Industries
Reliance opens at ₹1,280 and immediately rallies to ₹1,298 on 3x volume after a positive joint venture announcement. RSI on the 5-minute chart hits 62. Price then pulls back to ₹1,291 over two candles. Entry is at ₹1,294 as price breaks the pullback high. Stop-loss is at ₹1,288. Target is ₹1,306 for a 1:2 risk-to-reward ratio. The trade exits at ₹1,307 within 45 minutes.
Strategy 3: Breakout Trading — Enter When the Market Decides
Breakout trading is about identifying key price levels where stocks have historically stalled — resistance on the way up, support on the way down — and entering when price finally breaks through these levels with conviction. The breakout signals a change in the supply-demand balance, often leading to a powerful directional move.
Best for: Bank Nifty, large-cap NSE stocks Timeframe: 15-minute or 1-hour chart Key rule: No volume confirmation means no trade Risk-to-reward target: 1:2 to 1:4
How to Identify a Valid Breakout
Identify a horizontal resistance level that has been tested at least two to three times in the past five to ten trading sessions. The more times it has held, the stronger the breakout will be when it finally happens. Wait for a 15-minute candle to close above resistance — not just wick above it. A close is commitment. A wick is noise.
Volume must be at least 1.5 to 2 times the 20-period average volume. A breakout on low volume is almost always a false breakout. This single filter eliminates the majority of bad trades. Enter on the open of the candle after the breakout candle. Stop-loss goes just below the broken resistance level, which should now act as support. Target the previous swing high or 2 times the distance from your entry to your stop-loss.
If price immediately reverses and closes back below the breakout level within one or two candles, exit immediately. This is a failed breakout and the trade thesis is wrong. Do not hold and hope.
The best time of day for valid breakouts is between 9:30 AM and 11:30 AM IST, and again between 2:00 PM and 3:00 PM IST. Avoid taking breakout trades between 11:30 AM and 1:30 PM during the lunch lull — volume drops and false signals multiply during this period.
Strategy 4: Pullback / Retracement Strategy — Buy the Dip, Sell the Rally
The pullback strategy is one of the most reliable intraday methods because it puts probability on your side. You are entering in the direction of the larger trend but at a better price than if you had chased the initial move. This approach is used by traders across all global markets — from NSE stocks to S&P 500 futures and FTSE 100 CFDs.
Best for: Trend days, all markets globally Timeframe: 15-minute chart for trend, 5-minute for entry Key indicators: Fibonacci retracement, EMA 21, RSI Risk-to-reward target: 1:2 minimum
The Logic
After a strong directional move called the impulse, price typically pulls back 38.2%, 50%, or 61.8% of that move before continuing in the original direction. These are the Fibonacci retracement levels, used by traders worldwide because institutional algorithms are programmed to look for entries at these exact zones.
Identify an established intraday uptrend on the 15-minute chart where price is making higher highs and higher lows and trading above the 21 EMA. After a strong bullish impulse move, draw Fibonacci retracement from the swing low to the swing high. Wait for price to pull back to the 50% or 61.8% Fibonacci level — these are the highest probability entry zones. The 38.2% zone also works in a very strong trend.
Look for bullish reversal confirmation at the Fibonacci zone: a bullish engulfing candle, a doji followed by a green candle, or RSI turning up from below 45. Enter long with your stop-loss 10 to 15 points below the Fibonacci level you used. Target the previous high and then trail your stop-loss.
Real Example — Nifty 50 Intraday
Nifty rallies from 22,600 to 22,820 in the first hour — a 220-point impulse move. The 50% retracement level sits at 22,710. Price pulls back to 22,714 and forms a bullish engulfing candle on the 5-minute chart with RSI at 44. Entry is at 22,720. Stop-loss is at 22,695, which is 25 points of risk. Target is 22,820 and beyond — 100 points of reward for a 1:4 risk-to-reward ratio.
Strategy 5: Scalping — Small Profits, Repeated Many Times
Scalping is the highest-frequency intraday approach. Scalpers make 10 to 25 trades per session, targeting 5 to 15 Nifty points or 0.1 to 0.3% per trade on stocks. The power is in volume and discipline — 15 winning trades of 10 points each beats one big trade of 150 points that you hold nervously for 2 hours. Scalping demands lightning-fast execution, strict stop-losses, and a broker with low latency and flat-fee brokerage on intraday trades.
Best for: Highly liquid NSE stocks, Nifty Futures Timeframe: 1-minute, 3-minute, or 5-minute chart Risk per trade: 0.2 to 0.5% of capital Non-negotiable rule: Stop-loss on every single trade
Scalping Rules
Only scalp stocks with a bid-ask spread under ₹0.05 or 0.01%. Wide spreads eat your profits before the trade even starts. Stick to the top 20 NSE stocks by volume — Reliance, HDFC Bank, Infosys, TCS, ICICI Bank, and similar names. Use VWAP as your compass. Buy when price pulls back to VWAP and bounces in an uptrend. Sell when price pulls back to VWAP and reverses down in a downtrend.
Your stop-loss must be placed before you enter the trade — not after it goes against you. Scalping stop-losses are 10 to 25 Nifty points or 0.2 to 0.3% on stocks. They are tight and absolutely non-negotiable. Take profit at 1.5 to 2 times your stop-loss distance. Do not get greedy on scalps — the point is frequency, not home runs.
Stop scalping if you have three consecutive losing trades. Take a 30-minute break and review what happened. Revenge scalping after losses is the fastest way to blow an account. The best scalping windows in India are 9:15 AM to 10:30 AM IST and 2:00 PM to 3:00 PM IST. Avoid scalping between 11:30 AM and 1:30 PM when volume drops and spreads widen across the board.
An important note on costs: scalping involves significant brokerage costs if you are on a per-order plan. Use a flat-fee broker like Zerodha, Upstox, or Groww, and calculate your break-even point before deciding whether scalping is worth it for your account size.
Strategy 6: EMA Crossover — The Trend-Following Classic
The Exponential Moving Average crossover is one of the oldest and most reliable trend-identification tools in technical analysis. Unlike a Simple Moving Average, the EMA gives more weight to recent price data, making it more responsive to current market conditions. The crossover between a short-term and long-term EMA gives clean, mechanical signals that remove emotion from the decision entirely.
Best for: Trend days, beginners building discipline Timeframe: 15-minute chart EMAs used: 9 EMA as the fast line, 21 EMA as the slow line Confirmation indicators: MACD and Volume
Setup Rules
Add a 9-period EMA and 21-period EMA to your 15-minute chart on TradingView or Zerodha Kite. A buy signal occurs when the 9 EMA crosses above the 21 EMA and a candle closes above both EMAs, with price trending up rather than oscillating randomly around the lines. A sell signal occurs when the 9 EMA crosses below the 21 EMA and a candle closes below both.
Confirm every crossover signal with the MACD. The MACD line should be above the signal line for buy setups and below it for sell setups. This filter eliminates many false crossovers in choppy markets and is worth applying every time. Enter at the close of the signal candle. Stop-loss sits just below the 21 EMA for long trades. Trail your stop by exiting when price closes below the 9 EMA.
The most important warning for this strategy: the EMA crossover produces frequent false signals in sideways, range-bound markets. Always check the 1-hour chart first. If Nifty is stuck between two price levels without clear direction, avoid the EMA crossover entirely and wait for a trending day before using it.
Strategy 7: News-Based / Event Catalyst Trading — When Markets Move Fast
Some of the biggest intraday moves happen around predictable events: RBI monetary policy decisions, quarterly earnings releases, US Fed rate announcements, the Union Budget, and major geopolitical developments. News-based trading means positioning yourself before or immediately after these catalysts and riding the resulting volatility with clear rules.
Best for: Event days, experienced traders, options buyers Key events: RBI Policy, US Fed decisions, corporate earnings, Union Budget Best instruments: Bank Nifty Options, Stock Options Risk level: High — recommended for traders with at least 6 months of intraday experience
How to Trade Around Events
Before any major event, check India VIX. High VIX above 16 to 18 means the market expects a big move and option premiums are expensive. Low VIX means cheaper option plays are available. Mark key support and resistance levels on Bank Nifty and Nifty before the event announcement.
RBI Repo Rate decisions typically move Bank Nifty between 300 and 800 points immediately after the announcement. A rate cut is bullish for banking stocks. A rate hike or hawkish tone is bearish. Position accordingly, but always with predefined stop-losses since the initial reaction is sometimes reversed within 30 to 60 minutes.
US Federal Reserve announcements affect Indian markets strongly the following morning. A dovish Fed with lower rates or accommodative language typically leads to a gap-up open on NSE. A hawkish surprise causes gap-downs. Quarterly earnings results should only be traded when they are a clear beat or a clear miss versus analyst expectations. Avoid trading mixed results — the market's reaction to ambiguous earnings is completely unpredictable.
On all news and event days, use 50% of your normal position size. News-driven volatility can hit your stop-loss instantly through price gapping. Buying options rather than trading futures is safer on high-impact event days because your maximum loss is limited to the premium paid.
Best Trading Times for India, US, UK and Australia
Timing matters as much as strategy. The same setup will behave very differently in the first 30 minutes of the session compared to the midday lull.
For Indian markets on NSE and BSE, the 9:15 AM to 10:30 AM IST window is the high volatility period best suited for ORB, Breakout, and Momentum strategies. Institutional orders hit the market during this time, setting the day's direction with the highest volume of the session. From 10:30 AM to 11:30 AM, trend continuation trades work well if a breakout occurred at the open. Between 11:30 AM and 1:30 PM, the market often goes sideways with low volume, causing choppy price action and increased false signals — best avoided for trend-based strategies. The 2:00 PM to 3:15 PM closing hour sees volume return as institutional rebalancing begins, offering strong momentum opportunities before the mandatory square-off.
For US traders on NYSE and NASDAQ, the 9:30 AM to 11:00 AM ET window is the prime session, equivalent to 7:00 PM to 8:30 PM IST. UK traders on the LSE work best between 8:00 AM and 9:30 AM GMT, which is 1:30 PM to 3:00 PM IST. Australian ASX 200 traders use the 10:00 AM to 11:30 AM AEST window, which is 5:30 AM to 7:00 AM IST for Indian-based NRI traders. DAX traders in Europe work the 9:00 AM to 11:00 AM CET window, equivalent to 1:30 PM to 3:30 PM IST.
6 Intraday Trading Mistakes That Destroy Accounts
Knowing the right strategies is only half the equation. The other half is knowing what not to do. These six mistakes are responsible for the majority of intraday trading losses in India and globally.
Trading Without a Stop-Loss
"The market will come back" is one of the most expensive beliefs in trading. One uncapped loss can wipe out 10 winning trades. Place your stop-loss before you enter — every single time, without exception, regardless of how confident you feel about the trade.
Overtrading
More trades do not mean more profits. Professional intraday traders often take just 2 to 4 trades per day, not 20. Overtrading multiplies brokerage costs, tax liabilities, and emotional errors simultaneously. Take only high-conviction setups that match your strategy criteria exactly, and pass on everything else.
Trading Against the Trend
Trying to catch tops and bottoms is tempting but statistically a losing game. 80% of the time the trend continues. Trade with it, not against it. The classic saying applies here: the trend is your friend until it isn't.
Letting Emotions Drive Decisions
Fear makes you exit winners too early. Greed makes you hold losers too long. Revenge trading after a loss leads to bigger losses in almost every case. Write your setup rules on paper and follow them mechanically. If you deviate from your rules, stop trading for the day and review why.
Skipping Paper Trading and Backtesting
Never trade a new strategy with real money immediately. Spend at least 2 to 4 weeks paper trading it — tracking results, finding edge cases, and building confidence before putting real capital at risk. Most traders skip this step and pay for it with real losses.
Ignoring Brokerage, Taxes, and Slippage
In India, intraday profits attract income tax at your applicable slab rate, plus Securities Transaction Tax, exchange charges, and GST on brokerage. On scalping trades with a ₹5,000 capital base and 20 trades per day, costs alone can easily exceed ₹300 to ₹500 per day. Always calculate your break-even point before choosing a strategy for your account size.
Your Pre-Trade Checklist — Use This Every Morning
Before placing any intraday trade in 2026, run through this list. Experienced traders complete it in under 10 minutes. It eliminates the biggest emotional and analytical errors before you open a single position.
Check overnight global cues including US futures, SGX Nifty, and crude oil prices. Note any major events scheduled for the day such as RBI meetings, US data releases, or corporate earnings. Mark yesterday's high, low, and close on both Nifty and Bank Nifty. Identify key intraday support and resistance levels from the 1-hour chart. Check India VIX — above 18 means higher risk, so tighten your position sizes accordingly. Confirm the strategy you will trade today and commit to it. Set your maximum daily loss limit before opening any trades. Ensure your stop-loss is calculated for every setup you are watching. Review your last 5 trades to identify what worked and what did not. Close all distracting apps and social media during trading hours.
Frequently Asked Questions
Which intraday strategy is best for beginners in India?
The Opening Range Breakout is the best starting point for beginners because it has clear, unambiguous rules: mark two levels, wait for a confirmed breakout, set your stop-loss, and trade. There is no interpretation required. Spend 3 to 4 weeks paper trading it before going live with real capital.
How much money do I need to start intraday trading in India?
You can technically start with ₹10,000 to ₹25,000 for stock intraday trades on NSE. For Nifty and Bank Nifty futures or options, ₹50,000 to ₹1,00,000 is a more practical starting amount that gives you room for proper risk management without being over-leveraged. Start small and scale only after 3 or more months of consistent profitability.
What is the best timeframe for intraday trading?
The 15-minute chart is the most popular timeframe for intraday trading in India. It filters out the noise of the 1-minute and 5-minute charts while still giving you enough trade opportunities during the session. Use the 1-hour chart to identify the daily trend and the 15-minute chart for your entries. Scalpers may use the 3-minute or 5-minute chart.
Can I trade Nifty and Bank Nifty from the US, UK, or Australia?
Yes, many NRI traders actively trade Indian markets from overseas. NSE is accessible via most Indian brokers including Zerodha and Upstox for NRIs with NRE or NRO accounts. The NSE session runs from 9:15 AM to 3:30 PM IST — that is 3:45 AM to 10:00 AM ET, 8:45 AM to 2:00 PM GMT, and 6:45 PM to 12:00 AM AEST.
What indicators should a beginner use for intraday trading?
Start with just three: Volume to confirm every signal, EMA 9 and 21 to identify trend direction, and RSI to identify overbought and oversold conditions. Adding more indicators beyond these three creates confusion and contradictory signals. Master these first before adding anything else to your charts.
Is intraday trading taxed differently in India?
Yes. Intraday equity trading profits are classified as speculative business income in India, not as capital gains. They are taxed at your applicable income tax slab rate, which can reach 30% for high earners. Futures and options profits are classified as non-speculative business income, also taxed at your slab rate. Always consult a CA or qualified tax advisor for your specific situation.
Disclaimer:- Trading in securities markets carries substantial risk and is not suitable for everyone. Past performance is not indicative of future results. This article is for educational purposes only and should not be construed as investment advice. Please conduct your own research and consult a SEBI-registered financial advisor before making trading or investment decisions.
© 2026 Amuktha Trading. Telangana, India. Serving global traders since 2013.