
The Ultimate Bank Nifty Trading Guide 2026: Master India's Premier Banking Index
Last Updated: January 27, 2026
Quick Navigation
What is Bank Nifty?
Index Composition & Weightage
Trading Hours & Specifications
Technical Analysis & Chart Reading
Bank Nifty Futures Trading
Bank Nifty Options Strategies
Live Trading Tools & Resources
Proven Trading Strategies
Risk Management Guidelines
Frequently Asked Questions
The Bank Nifty index has emerged as one of India's most actively traded financial instruments, attracting both seasoned traders and newcomers to the derivatives market. Whether you're looking to trade Bank Nifty options, futures, or simply understand how this crucial index works, this comprehensive guide provides everything you need to know to navigate the banking sector index successfully.
In this detailed resource, you'll discover proven trading strategies, learn how to read Bank Nifty charts effectively, understand the option chain dynamics, and master risk management techniques that professional traders use daily. We've compiled insights from years of trading experience to help you make informed decisions in the fast-paced world of Bank Nifty trading.
What is Bank Nifty? Understanding India's Banking Index
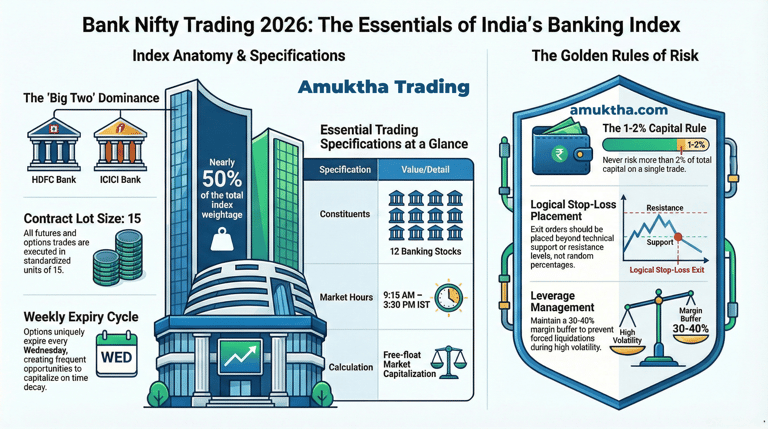
Bank Nifty, officially known as the Nifty Bank Index, is a benchmark index that represents the performance of the 12 most liquid and large-cap banking stocks listed on the National Stock Exchange (NSE) of India. Launched on January 1, 2000, with a base value of 1,000, this index has become a critical barometer for measuring the health and performance of India's banking sector.
Why Bank Nifty Matters to Traders
Bank Nifty serves multiple crucial functions in the Indian financial market. First, it provides a single metric to track the banking sector's overall performance, eliminating the need to monitor individual bank stocks separately. Second, it offers high volatility compared to broader indices like Nifty 50, creating numerous intraday and swing trading opportunities. Third, with derivatives available in both futures and options, traders can employ sophisticated strategies including hedging, speculation, and arbitrage.
The index is particularly attractive to derivatives traders because of its liquidity. Daily trading volumes in Bank Nifty futures and options often exceed those of many individual stocks, ensuring tight bid-ask spreads and minimal slippage. This liquidity, combined with significant price movements, makes Bank Nifty an ideal instrument for both day traders and positional traders.
How Bank Nifty is Calculated
Bank Nifty uses the free-float market capitalization method for calculation. This means only the shares readily available for trading in the market (excluding promoter holdings, government holdings, and strategic investments) are considered. The index value is calculated by dividing the current market capitalization by the base market capitalization and multiplying by the base index value of 1,000.
The formula is: Bank Nifty = (Current Market Value / Base Market Value) × Base Index Value
NSE reviews and rebalances the index composition semi-annually (January and July) to ensure it accurately represents the banking sector's performance. Stocks can be added or removed based on criteria including market capitalization, trading frequency, and listing history.
Bank Nifty Composition and Weightage: Know the Major Players
Understanding the Bank Nifty composition and weightage is crucial for predicting index movements. The index comprises 12 banking stocks, but not all stocks have equal influence. The weightage is determined by the free-float market capitalization of each constituent stock, meaning larger banks with higher market values have a greater impact on the index.
Top Bank Nifty Constituents by Weightage (2026)
As of January 2026, the major constituents typically include HDFC Bank, ICICI Bank, State Bank of India (SBI), Kotak Mahindra Bank, Axis Bank, IndusInd Bank, Bank of Baroda, Punjab National Bank (PNB), IDFC First Bank, Bandhan Bank, Federal Bank, and AU Small Finance Bank. However, exact weightages change based on market capitalizations.
HDFC Bank generally commands the highest weightage, often accounting for 25-30% of the index. This means that a 1% move in HDFC Bank can cause approximately 0.25-0.30% movement in Bank Nifty. ICICI Bank typically follows with 20-25% weightage, making these two banks responsible for nearly half of the index's movements.
Why Weightage Matters for Trading
When trading Bank Nifty, monitoring the top 3-4 weighted stocks is essential. If HDFC Bank and ICICI Bank are both trading in the green, Bank Nifty will likely be positive even if several smaller-weighted banks are down. Conversely, significant negative movement in these heavyweight stocks can drag the entire index down.
Smart traders often check individual stock charts of HDFC Bank, ICICI Bank, and SBI before taking positions in Bank Nifty derivatives. Understanding the correlation between these stocks and the index helps in making more informed trading decisions. For instance, if you notice divergence where the index is moving up but the top-weighted stocks are weak, it could signal a potential reversal.
Sector Representation
Bank Nifty includes both private sector banks (HDFC Bank, ICICI Bank, Axis Bank, Kotak Mahindra Bank) and public sector banks (SBI, Bank of Baroda, PNB). Private banks typically have higher weightages due to larger market capitalizations. The index also includes newer-age banks and small finance banks, ensuring comprehensive sector coverage.
Bank Nifty Trading Hours and Contract Specifications
Trading Timings
Bank Nifty derivatives (futures and options) trade on the NSE during regular market hours from 9:15 AM to 3:30 PM IST on all trading days. The pre-market session runs from 9:00 AM to 9:15 AM, where orders are collected but not executed until the regular market opens.
The most volatile periods typically occur during the first 15 minutes (9:15-9:30 AM), lunch hour (12:00-1:00 PM), and the last 30 minutes (3:00-3:30 PM). The opening session often sees maximum volatility due to overnight news, global market cues, and gap openings. The closing session experiences heightened activity as institutional traders square off positions and as traders adjust to the closing settlement price.
Contract Specifications for Bank Nifty Futures
Bank Nifty futures contracts have specific standardized terms. The lot size is currently 15 (as of 2025), meaning one contract represents 15 units of the Bank Nifty index. If Bank Nifty is trading at 45,000, the contract value would be 45,000 × 15 = ₹6,75,000.
Futures contracts are available for three months: the current month (near month), next month (middle month), and far month. They expire on the last Thursday of each month. If the last Thursday is a trading holiday, the expiry moves to the previous trading day.
The tick size (minimum price movement) is 0.05 index points, which translates to ₹0.75 per contract (0.05 × 15). Margin requirements vary based on volatility but typically range from 10-15% of the contract value for intraday trading and higher for overnight positions.
Contract Specifications for Bank Nifty Options
Bank Nifty options have the same lot size of 15. Strike prices are available at intervals of 100 points, providing numerous trading opportunities across different price levels. Both call options (right to buy) and put options (right to sell) are available for each strike price.
Options expire weekly on Wednesdays, making Bank Nifty one of the few indices with weekly expiries in India. Monthly contracts expire on the last Wednesday of each month. This weekly expiry feature creates unique opportunities for traders, including strategies specifically designed for time decay and volatility trading.
Premium prices for options are quoted in index points. If a call option is trading at 150 points, the actual premium paid would be 150 × 15 = ₹2,250 per contract. Options can be traded in multiples of the lot size.
Bank Nifty Chart Analysis: Reading the Markets Like a Pro
Technical analysis of Bank Nifty charts is fundamental to successful trading. Whether you're a day trader looking at 5-minute charts or a swing trader analyzing daily patterns, understanding chart dynamics is crucial for timing entries and exits.
Understanding Bank Nifty Chart Types
Traders primarily use three chart types for Bank Nifty analysis. Candlestick charts are the most popular, displaying open, high, low, and close prices within a single visual element. The candle body shows the difference between open and close, while wicks represent the high and low of the period. Green (or white) candles indicate bullish periods where the close was higher than the open, while red (or black) candles show bearish periods.
Line charts connect closing prices and are useful for identifying overall trends without the noise of intraday fluctuations. Bar charts display the same information as candlestick charts but in a different format, with vertical lines representing the high-low range and horizontal ticks showing open and close prices.
Key Time Frames for Bank Nifty Trading
Successful traders use multiple time frames for comprehensive analysis. The 5-minute chart is ideal for scalping and very short-term trades, capturing quick price movements during volatile periods. The 15-minute chart suits intraday traders who hold positions for several hours, providing a balance between detail and the bigger picture.
The 1-hour chart helps identify intraday trends and is particularly useful for day traders looking to understand the overall direction before taking positions. Daily charts are essential for swing traders and positional traders, revealing major support and resistance levels that remain relevant for weeks or months.
Professional traders often use a top-down approach: starting with the daily chart to understand the major trend, then moving to hourly charts for intermediate trends, and finally using 15-minute or 5-minute charts for precise entry and exit timing.
Identifying Support and Resistance Levels
Support and resistance levels are price points where the index historically tends to reverse or consolidate. Support represents a price level where buying interest is strong enough to overcome selling pressure, preventing further decline. Resistance is where selling pressure overcomes buying interest, capping upward movement.
To identify support levels on Bank Nifty charts, look for areas where the index has bounced up multiple times. These are often round numbers (45,000, 44,500) or previous swing lows. The more times a level has held, the stronger the support. Similarly, resistance levels are identified by areas where the index has repeatedly failed to break higher, often at previous swing highs or psychologically significant levels.
When support is broken, it often becomes resistance (and vice versa). For example, if Bank Nifty breaks below 45,000 support, that level may act as resistance on subsequent rallies. This role reversal is a key concept in technical analysis and helps traders identify potential entry and exit points.
Understanding Bank Nifty Candlestick Patterns
Candlestick patterns provide valuable insights into market sentiment and potential reversals. A bullish engulfing pattern, where a large green candle completely engulfs the previous red candle, often signals a potential uptrend. A bearish engulfing pattern indicates possible downside.
Doji candles, where the open and close are nearly equal, suggest indecision in the market and often precede significant moves. Morning star and evening star patterns are three-candle formations that signal potential reversals at the bottom and top, respectively.
Hammer and shooting star candles indicate potential reversals. A hammer at support with a small body and long lower wick suggests buyers are stepping in. A shooting star at resistance with a long upper wick indicates sellers are rejecting higher prices.
Using Technical Indicators Effectively
Moving averages smooth out price data and help identify trends. The 20-day moving average is popular for short-term trends, while 50-day and 200-day moving averages indicate longer-term trends. When Bank Nifty trades above its 20-day moving average, it's generally in a short-term uptrend.
The Relative Strength Index (RSI) measures momentum and identifies overbought or oversold conditions. RSI above 70 suggests the index may be overbought and due for a pullback, while RSI below 30 indicates oversold conditions and a potential bounce. However, in strong trends, RSI can remain in overbought or oversold territory for extended periods.
MACD (Moving Average Convergence Divergence) helps identify trend changes and momentum shifts. When the MACD line crosses above the signal line, it generates a bullish signal. Conversely, a cross below suggests bearish momentum.
Bollinger Bands measure volatility. When Bank Nifty trades near the upper band, it may be overextended to the upside. Trading near the lower band suggests potential support. Band squeezes, where the bands narrow, often precede significant breakouts in either direction.
Volume Analysis in Bank Nifty
Volume confirms price movements. Rising prices on high volume indicate strong buying interest and sustainable uptrends. Rising prices on low volume suggest weak conviction and potential reversals. Similarly, falling prices on high volume confirm selling pressure, while declining prices on low volume may indicate oversold conditions ripe for a bounce.
Volume spikes at support or resistance levels are particularly significant. High volume at support suggests strong buying interest and increases the likelihood the support will hold. High volume at resistance breaking indicates strong momentum and increases the probability of a sustained breakout.
Bank Nifty Futures Trading: Strategies and Techniques
Bank Nifty futures are derivative contracts that derive their value from the Bank Nifty index. Trading futures offers leverage, allowing traders to control large positions with relatively small capital. However, this leverage also amplifies both profits and losses, making risk management critical.
Why Trade Bank Nifty Futures?
Futures offer several advantages over trading individual stocks. First, you can take a directional view on the entire banking sector without worrying about stock-specific risks. Second, futures provide high leverage, typically allowing you to control contract values 6-10 times your margin deposit. Third, both long (bullish) and short (bearish) positions are equally easy to establish, unlike stocks where short-selling has additional constraints.
Futures are also highly liquid, with tight bid-ask spreads ensuring minimal transaction costs. The standardized contracts and transparent pricing make futures ideal for both hedging and speculation. Institutional investors use Bank Nifty futures to hedge their banking sector equity portfolios, while retail traders use them for directional trading.
Understanding Futures Pricing and Fair Value
Bank Nifty futures typically trade at a premium to the spot index due to the cost of carry (interest costs minus dividends). This premium decreases as expiry approaches, eventually converging to the spot price on expiry day. The difference between futures and spot is called the basis.
Fair value can be approximated using the formula: Futures Price = Spot Price × (1 + r × t/365), where r is the risk-free interest rate and t is days to expiry. When futures trade significantly above fair value, it indicates bullish sentiment (backwardation). When futures trade below fair value, it suggests bearish sentiment (contango).
Bank Nifty Futures Trading Strategies
Trend following is one of the most effective strategies for futures trading. When Bank Nifty is in a clear uptrend (making higher highs and higher lows), traders take long positions near support levels or on breakouts of resistance. In downtrends, short positions are taken near resistance or on breakdowns below support.
Breakout trading involves identifying consolidation ranges and taking positions when the index breaks out. For example, if Bank Nifty consolidates between 44,500 and 45,000 for several days, a breakout above 45,000 on high volume could signal a long entry opportunity. Stop-loss is placed just below the breakout level.
Range trading works well in sideways markets. When Bank Nifty is stuck between strong support and resistance, traders buy near support and sell near resistance. This strategy requires discipline to cut losses if the range breaks.
Spread trading involves taking opposite positions in different contract months. For instance, if you expect the near-month futures to outperform the far-month, you buy near-month and sell far-month contracts. This strategy profits from changes in the price difference between contracts and typically has lower risk than outright positions.
Managing Futures Positions
Position sizing is crucial in futures trading. Never risk more than 1-2% of your capital on a single trade. Given the leverage in futures, this often means trading just one or two lots even with moderate capital. Overtrading is a common mistake that leads to significant losses.
Always use stop-loss orders to limit downside risk. A common approach is placing stops just beyond recent swing highs (for short positions) or swing lows (for long positions). Alternatively, use a percentage-based stop, such as exiting if the trade moves 1-2% against you.
Taking partial profits can improve overall results. When a trade moves in your favor, consider booking partial profits at the first target and trailing the stop-loss on the remaining position. This ensures you capture some gains while allowing the possibility of larger profits if the trend continues.
Rollover Strategy for Futures
As expiry approaches, traders carrying positions must decide whether to square off or roll over to the next month. Rollover involves closing the current month position and simultaneously opening a new position in the next month contract.
Monitor the rollover data published by exchanges, as it provides insights into market sentiment. High rollover of long positions suggests bullish sentiment, while high rollover of short positions indicates bearish outlook. Significant increase or decrease in open interest during rollover can signal trend strength or weakness.
Bank Nifty Options Trading: Comprehensive Strategies Guide
Bank Nifty options provide flexible trading opportunities with defined risk for buyers and premium income opportunities for sellers. Understanding options mechanics and strategies is essential for success in this complex but rewarding market.
Understanding Bank Nifty Options Basics
Call options give the buyer the right (but not obligation) to buy Bank Nifty at a specified strike price. Traders buy calls when they expect the index to rise. Put options give the buyer the right to sell at a specified strike price, used when expecting the index to fall.
Options have intrinsic value and time value. Intrinsic value is the immediate profit if exercised (for in-the-money options), while time value is the additional premium paid for the potential of future profits. Time value decays as expiry approaches, accelerating in the final week.
At-the-money (ATM) options have strike prices closest to the current index level. In-the-money (ITM) options have intrinsic value, while out-of-the-money (OTM) options have only time value. ATM options typically have the highest liquidity and volume.
The Bank Nifty Option Chain Explained
The option chain displays all available strike prices with their corresponding call and put premiums, open interest, and trading volumes. Reading the option chain effectively is crucial for understanding market sentiment and identifying trading opportunities.
Open interest (OI) represents the total number of outstanding contracts at each strike. High OI at a particular strike suggests that level is significant, often acting as support or resistance. An increase in call OI suggests bullish sentiment, while increasing put OI indicates bearish sentiment.
The Put-Call Ratio (PCR) is calculated by dividing total put OI by total call OI. PCR above 1.0 suggests more puts than calls, often interpreted as bullish (as puts are typically used for hedging by long holders). PCR below 1.0 indicates more calls, potentially signaling bearish sentiment as a contrarian indicator. However, PCR should be used in conjunction with other indicators, not in isolation.
Understanding Max Pain Theory
Max pain is the strike price at which the maximum number of options (both calls and puts) expire worthless, theoretically causing maximum loss to option buyers and maximum profit to option sellers. The theory suggests that prices tend to gravitate toward the max pain level as expiry approaches.
While max pain is not always accurate, it provides insights into where major option writers (often institutions) have positioned themselves. If Bank Nifty is trading significantly away from max pain near expiry, expect volatile moves as the index potentially gravitates toward that level.
Calculate max pain by identifying the strike where the sum of call and put intrinsic values (for option writers) is minimized. Several websites and trading platforms display real-time max pain calculations for convenience.
Simple Options Strategies for Beginners
Long call buying is the simplest bullish strategy. Purchase a call option when expecting Bank Nifty to rise significantly. The maximum loss is limited to the premium paid, while profit potential is unlimited. This strategy works best in trending markets with expected volatility.
Long put buying is the mirror strategy for bearish outlooks. Buy puts when expecting significant declines. Maximum loss is the premium paid, with substantial profit potential as the index falls. Puts can also hedge existing long equity positions in banking stocks.
Covered call writing involves holding banking stocks or Bank Nifty futures and selling call options against them. This generates premium income and works well in range-bound or slightly bullish markets. The risk is capping upside potential if the index rallies strongly.
Advanced Options Strategies
Bull call spread involves buying a call at a lower strike and selling a call at a higher strike. This reduces the cost compared to buying a call outright while limiting maximum profit. It's ideal when expecting moderate upside with controlled risk.
Bear put spread is the bearish equivalent, buying a put at a higher strike and selling a put at a lower strike. This strategy profits from moderate declines while limiting both maximum loss and maximum profit.
Iron condor combines a bull put spread and a bear call spread, profiting from low volatility and range-bound movement. Sell an OTM put and buy a further OTM put (bull put spread), then sell an OTM call and buy a further OTM call (bear call spread). Maximum profit occurs if Bank Nifty expires between the short strikes.
Straddle involves buying both a call and put at the same strike (typically ATM). This strategy profits from significant movement in either direction and is ideal before major events or announcements. The risk is time decay if the index remains stagnant.
Strangle is similar to a straddle but uses OTM strikes for both call and put, reducing initial cost but requiring larger moves to profit. This strategy suits situations where big movements are expected but direction is uncertain.
Weekly vs Monthly Options
Bank Nifty offers weekly expiries every Wednesday in addition to monthly expiries on the last Wednesday. Weekly options have faster time decay, making them attractive for sellers looking to capture premium quickly. However, the accelerated decay also means buyers need quicker, larger moves to profit.
Monthly options provide more time for trades to work out and are better suited for positions based on longer-term analysis. The slower decay allows for more patience but also means holding costs are higher.
Many traders use weekly options for short-term directional trades and event-based trading, while using monthly options for hedging and longer-term strategies. Understanding the time decay characteristics of each is essential for choosing the right expiry.
Greeks in Options Trading
Delta measures how much an option's price changes for a one-point move in Bank Nifty. ATM options have delta around 0.5, meaning they gain/lose approximately half a point for each point move in the index. ITM calls have delta approaching 1, while OTM calls have delta closer to 0.
Gamma measures the rate of change of delta. High gamma means delta changes rapidly as the index moves, creating both opportunity and risk. ATM options have the highest gamma, especially near expiry.
Theta represents time decay, showing how much value an option loses each day. Theta is highest for ATM options and accelerates as expiry approaches. Option sellers benefit from positive theta, while buyers face negative theta.
Vega measures sensitivity to volatility changes. Options gain value when volatility increases and lose value when volatility decreases, regardless of index direction. This is why options often decline in value even after expiry-day settlement if volatility collapses.
Understanding Greeks helps in selecting appropriate strategies and managing risk. For instance, if you expect a quick move, high-gamma options offer maximum leverage. If you expect volatility to increase, high-vega positions benefit most.
Bank Nifty Live Trading Tools and Resources
Successful Bank Nifty trading requires access to reliable, real-time data and analytical tools. Modern traders use various platforms and resources to monitor market movements, analyze trends, and execute trades efficiently.
Essential Live Data Sources
The NSE official website provides authentic, real-time Bank Nifty data including current index value, futures prices, and options chains. This should be your primary source for official data, especially for verifying prices before placing orders.
TradingView offers sophisticated charting capabilities with customizable indicators, drawing tools, and the ability to save and share chart setups. The platform supports multi-timeframe analysis and includes community-shared scripts for advanced technical analysis. TradingView's Bank Nifty charts are particularly popular among retail traders for their clean interface and powerful features.
Google Finance and Investing.com provide quick access to Bank Nifty prices, news, and basic charts. These platforms are useful for getting a quick market snapshot on mobile devices or when you don't need advanced charting.
MoneyControl and Economic Times offer comprehensive coverage including Bank Nifty news, expert analysis, and commentary. Staying informed about banking sector developments, policy changes, and economic indicators is crucial for fundamental analysis.
Understanding Real-Time Option Chain Data
Live option chains should be monitored continuously, especially during market hours. Key metrics to watch include changes in open interest, implied volatility levels across strikes, and unusual volumes that might indicate large institutional positions.
Compare bid-ask spreads across different strikes to assess liquidity. Tight spreads (difference between buy and sell prices) indicate high liquidity and lower transaction costs. Wide spreads suggest illiquidity and potential difficulty in executing trades at desired prices.
Monitor the change in open interest (OI) throughout the day. Rapidly increasing OI at a particular strike suggests that level is becoming increasingly important. Decreasing OI indicates position closures and potentially weakening support or resistance.
Volatility Tracking Tools
India VIX, while calculated based on Nifty 50 options, provides a good proxy for overall market volatility including Bank Nifty. High VIX levels indicate fear and uncertainty, often corresponding with increased option premiums. Low VIX suggests complacency and cheaper options.
Bank Nifty implied volatility can be tracked through option pricing. When implied volatility is high, option premiums are expensive, favoring sellers. When implied volatility is low, options are cheaper, potentially favoring buyers expecting a volatility spike.
Historical volatility analysis helps compare current price movements to past patterns. If Bank Nifty is currently moving 1-2% daily but historically averages 1.5%, traders can assess whether current conditions represent unusually low or high volatility.
Mobile Trading Applications
Most brokers offer mobile apps with live Bank Nifty quotes, charts, and order placement capabilities. Popular broker apps include Zerodha Kite, Upstox Pro, Angel One, and ICICI Direct. These apps allow monitoring and trading on the go, essential for active traders.
Ensure your trading app provides real-time push notifications for price alerts, order executions, and margin calls. Setting alerts at key support and resistance levels helps you stay informed without constantly watching charts.
News and Event Calendars
Economic calendars track important events like RBI policy announcements, GDP releases, inflation data, and banking sector results. These events often create significant volatility in Bank Nifty, presenting both opportunities and risks.
Company-specific news about major banking stocks (HDFC Bank, ICICI Bank, SBI) can significantly impact Bank Nifty due to their high weightages. Setting up news alerts for these companies helps you stay ahead of market-moving developments.
Global market cues, particularly U.S. markets and Asian indices, influence Bank Nifty's opening and intraday movements. Monitoring overnight developments helps traders prepare for gap openings and plan their strategies accordingly.
Proven Bank Nifty Trading Strategies for Consistent Profits
Successful Bank Nifty trading requires more than just technical knowledge; it demands proven strategies, discipline, and proper execution. Here are detailed strategies used by professional traders to navigate the Bank Nifty market.
Intraday Trading Strategies
The opening range breakout strategy is popular among day traders. Identify the first 15-30 minutes' high and low after market open. A breakout above this range on strong volume signals a potential long entry, while a breakdown suggests a short opportunity. Place stops just beyond the opposite end of the range.
VWAP (Volume Weighted Average Price) trading uses the day's VWAP as a dynamic support/resistance level. When Bank Nifty trades above VWAP, it's in a bullish mode; consider buying on dips to VWAP. When trading below VWAP, the index is bearish; consider selling rallies to VWAP. This strategy works well in trending markets.
Pivot point trading involves calculating daily pivot points and using them as support/resistance levels. The formula uses previous day's high, low, and close to calculate central pivot and multiple support/resistance levels. Trading bounces off these levels or breakouts beyond them provides clear entry and exit signals.
Swing Trading Strategies
Trend-following strategies identify the primary trend using daily charts and take positions in the direction of the trend. Enter on pullbacks to moving averages or support levels in uptrends, and rallies to resistance or moving averages in downtrends. Hold positions for several days to weeks, allowing trends to fully develop.
Mean reversion strategies capitalize on the tendency of prices to return to average levels after extreme moves. When RSI exceeds 70 or falls below 30, look for reversal signals. Combine with support/resistance levels for higher probability trades. This strategy works best in range-bound markets.
Pattern-based trading identifies chart patterns like head and shoulders, double tops/bottoms, triangles, and flags. These patterns provide specific entry points, stop-loss levels, and profit targets based on pattern measurements. Pattern trading requires patience to wait for proper formations and confirmations.
Options-Specific Strategies
Weekly options selling strategies involve selling OTM options on Monday and holding until Wednesday expiry, capturing time decay. The key is selecting strikes with high probability of expiring worthless while maintaining adequate risk management. Use technical levels to identify appropriate strikes.
Event-based straddle/strangle trading involves buying straddles or strangles before major events like RBI policy meetings or banking sector results. The strategy profits from volatility expansion as the event approaches and from actual price movement following the announcement. Exit before or immediately after the event to avoid volatility collapse.
Ratio spreads involve buying options and selling more options at different strikes. For example, buy one ATM call and sell two OTM calls. This creates a profit range with reduced cost but introduces risk if the market moves too far. Ratio spreads work well when expecting moderate movement within a defined range.
Hedging Strategies
Portfolio hedging uses Bank Nifty puts to protect banking stock holdings. If you own a portfolio of banking stocks, buying puts provides insurance against market declines. The cost of puts is like an insurance premium, protecting your portfolio during market downturns.
Collar strategies combine covered call writing with protective put buying. Hold banking stocks, sell calls to generate income, and use that income to partially or fully fund put purchases. This creates a defined risk range with reduced upside but strong downside protection.
Arbitrage and Advanced Strategies
Calendar spreads involve selling near-month options and buying far-month options at the same strike. This strategy profits from faster time decay of near-month options and works best in low-volatility environments. It's a more conservative strategy with limited risk and limited profit potential.
Futures-options arbitrage identifies pricing discrepancies between futures and synthetic futures (created using options). When futures are overpriced relative to synthetic positions, traders can sell futures and buy synthetic longs for risk-free profits. This requires quick execution and is typically exploited by algorithmic traders.
Risk Management: Protecting Your Capital in Bank Nifty Trading
Risk management is the cornerstone of successful trading. Even the best strategies will fail without proper risk controls. Bank Nifty's volatility demands disciplined risk management to survive and thrive in the market.
Position Sizing Fundamentals
Never risk more than 1-2% of your total capital on any single trade. If you have ₹5,00,000 in your trading account, the maximum risk per trade should be ₹5,000-₹10,000. This ensures that even a series of losses won't significantly deplete your capital.
Calculate position size based on your stop-loss distance. If you're buying Bank Nifty futures at 45,000 with a stop at 44,700 (300-point risk), and want to risk ₹7,500, you can trade 7,500 ÷ (300 × 15) = 1.67 lots, rounded down to 1 lot for safety.
Adjust position size based on trade confidence and market conditions. High-confidence setups with multiple confirmations might warrant 2% risk, while less certain trades should use 1% or less. In volatile markets, reduce position sizes to account for wider stops and increased slippage risk.
Stop-Loss Strategies
Always use stop-loss orders to limit downside. Never hope that a losing trade will recover; cutting losses quickly preserves capital for better opportunities. Place stops at logical levels just beyond support (for longs) or resistance (for shorts), not random percentages.
Technical stop-loss placement uses chart levels. For long positions, place stops below recent swing lows or support levels. For short positions, place stops above recent swing highs or resistance. This gives trades room to breathe while defining a clear invalidation point.
Time-based stops exit trades after a predetermined period if targets aren't reached. If you're day trading and a position hasn't moved favorably by 2 PM, consider exiting even without hitting the price stop. This prevents capital from being tied up in stagnant positions.
Trailing stops protect profits as trades move favorably. Once a position reaches a profit target, move the stop to breakeven. As the trade continues profiting, trail the stop to lock in gains while allowing further upside. A common approach is trailing the stop to protect 50-70% of open profits.
Leverage Management
While Bank Nifty derivatives offer significant leverage, using maximum leverage is dangerous. Moderate leverage (3-5x) allows you to amplify returns while maintaining enough margin buffer to withstand adverse movements without margin calls.
Avoid margin calls at all costs. Maintain at least 30-40% buffer over required margins. If your broker requires ₹1,00,000 margin for your positions, maintain ₹1,30,000-₹1,40,000 in your account. This buffer prevents forced liquidations during temporary adverse movements.
Never add to losing positions (averaging down) hoping for recovery. This violates risk management principles and often leads to catastrophic losses. If a trade is losing, it means your analysis was wrong; accept it and exit rather than increasing exposure.
Portfolio Diversification
Don't concentrate all trading capital in Bank Nifty. Diversify across different instruments (Nifty 50, sector indices, individual stocks) to reduce correlation risk. If all your trades are in banking stocks or Bank Nifty, a sector-specific event could wipe out your entire portfolio.
Diversify across time frames and strategies. Combine intraday trades, swing trades, and options strategies with different expiries. This ensures you're not overly dependent on any single market condition or time horizon.
Emotional Discipline and Psychology
Maintain a trading journal documenting every trade with entry reasons, exit reasons, emotions felt, and lessons learned. Regular review identifies patterns in your decision-making, helping you reinforce good habits and eliminate bad ones.
Avoid revenge trading after losses. Accept that losses are part of trading and taking time to analyze mistakes is more valuable than immediately jumping into another trade to recover losses. Emotional trading leads to poor decisions and compounds losses.
Take breaks after both significant wins and losses. Winning streaks can create overconfidence leading to excessive risk-taking, while losing streaks cause fear and hesitation. Step away from the market to regain perspective and emotional balance.
Follow your trading plan rigorously. Create specific rules for entries, exits, position sizing, and risk management, then follow them consistently. Most trading failures stem from not following plans rather than having bad plans.
Capital Preservation Rules
Establish a maximum daily loss limit (e.g., 3% of capital). If you reach this limit, stop trading for the day. This prevents emotional spiral where small losses turn into devastating drawdowns.
Set a maximum monthly loss limit (e.g., 10% of capital). If reached, take a break from trading for at least two weeks to reassess your strategies, review your trading journal, and ensure you're in the right mindset before resuming.
Never trade with money you can't afford to lose. Trading capital should be separate from essential living expenses, emergency funds, and long-term savings. Only risk discretionary income that won't affect your financial stability if lost.
Frequently Asked Questions About Bank Nifty Trading
What is the lot size of Bank Nifty futures and options?
The current lot size for Bank Nifty derivatives is 15. This means each contract represents 15 units of the Bank Nifty index. If Bank Nifty is trading at 45,000, one lot would have a value of ₹6,75,000 (45,000 × 15). Traders can only buy or sell in multiples of this lot size.
What are Bank Nifty trading hours?
Bank Nifty derivatives trade from 9:15 AM to 3:30 PM IST on all NSE trading days. The pre-market session runs from 9:00 AM to 9:15 AM where orders are collected but execution begins only at 9:15 AM when the regular market opens.
When do Bank Nifty options expire?
Bank Nifty has weekly options expiring every Wednesday and monthly options expiring on the last Wednesday of each month. If Wednesday is a trading holiday, the expiry moves to the previous trading day. This makes Bank Nifty one of the few indices in India with weekly expiries.
How much capital is needed to start trading Bank Nifty?
While technically you can start with the minimum margin required for one lot (typically ₹75,000-₹1,00,000 depending on volatility), prudent risk management suggests having at least ₹3,00,000-₹5,00,000 to trade comfortably. This provides adequate buffer for losses and allows proper position sizing without risking your entire capital on each trade.
What is the difference between Bank Nifty and Nifty 50?
Bank Nifty tracks only 12 banking stocks, making it a sectoral index, while Nifty 50 comprises 50 stocks across various sectors representing the broader market. Bank Nifty is typically more volatile than Nifty 50 because it's concentrated in one sector. Lot sizes also differ: Bank Nifty has a lot size of 15 while Nifty 50 has a lot size of 25 (as of 2025).
How is Bank Nifty affected by RBI policy announcements?
RBI monetary policy decisions significantly impact Bank Nifty. Interest rate changes affect banks' lending rates and net interest margins. Rate cuts generally boost banking stocks and Bank Nifty as they improve profitability and economic growth prospects. Rate hikes can pressure Bank Nifty initially but may eventually benefit from higher margins. Traders should be cautious around RBI meeting dates due to increased volatility.
Can I hold Bank Nifty options overnight?
Yes, you can hold Bank Nifty options overnight. However, be aware that holding options overnight carries additional risks including gap openings, overnight news, and time decay. Options positions held overnight also require higher margins than intraday positions. Many traders prefer to close options positions before market close to avoid overnight risk.
What is the best time to trade Bank Nifty during the day?
The first 30 minutes (9:15-9:45 AM) offer high volatility and liquidity but also increased risk due to gap openings and rapid moves. The lunch hour (12:00-1:00 PM) often sees consolidation with lower volumes. The last 30 minutes (3:00-3:30 PM) experience renewed volatility as traders square off positions. For beginners, trading after the opening volatility settles (10:00 AM-2:30 PM) may be safer.
How do I choose the right strike price for Bank Nifty options?
For buyers: ATM (at-the-money) and slightly OTM (out-of-the-money) options offer a balance between cost and profit potential. Deep OTM options are cheaper but have low probability of profit. For sellers: OTM options with 70-80% probability of expiring worthless provide decent premium with acceptable risk. The choice depends on your market outlook, risk tolerance, and strategy.
What is the maximum profit and loss in Bank Nifty options?
For option buyers: Maximum loss is limited to the premium paid, while maximum profit is theoretically unlimited for calls (or substantial for puts as the index can't go below zero). For option sellers: Maximum profit is limited to the premium received, while maximum loss is theoretically unlimited for calls (or very large for puts), making risk management crucial.
Should I trade Bank Nifty futures or options?
Futures suit traders with clear directional views who want leverage without time decay. They're simpler to understand and manage. Options are better for defined-risk strategies, hedging, and when you want to profit from volatility changes or time decay. Options offer more strategic flexibility but require understanding of Greeks and time decay. Beginners often start with options buying (limited risk) before progressing to futures or options selling.
How do global markets affect Bank Nifty?
U.S. markets, particularly banking sector performance and Federal Reserve policies, significantly influence Bank Nifty's overnight sentiment and opening. Asian markets provide real-time cues during Indian trading hours. Global risk-off events (geopolitical tensions, economic crises) typically pressure Bank Nifty as investors move to safe havens. Monitoring overnight developments in U.S. and Asian markets helps traders anticipate Bank Nifty's likely opening and intraday bias.
What are the tax implications of Bank Nifty trading?
Derivatives trading is considered speculative business income and is taxed at your applicable income tax slab rate. Futures and options profits/losses should be reported under "Income from Business and Profession" (not capital gains). You can offset losses against other speculative income. Maintain detailed trading records including contract notes, profit/loss statements, and tax computation sheets. Consider consulting a chartered accountant familiar with F&O trading taxation for proper compliance.
How do I improve my Bank Nifty trading skills?
Start with paper trading (simulated trading) to test strategies without risking real money. Maintain a detailed trading journal analyzing every trade. Study price action and technical analysis rather than relying solely on indicators. Learn from experienced traders through courses, mentorship, or trading communities. Specialize in one or two strategies initially before diversifying. Most importantly, focus on risk management and capital preservation rather than chasing quick profits.
Take Your Bank Nifty Trading to the Next Level with Amuktha
Mastering Bank Nifty trading is a journey that combines technical knowledge, strategic thinking, disciplined risk management, and emotional control. This comprehensive guide has covered the essential aspects from basic concepts to advanced strategies, but theoretical knowledge must be complemented with practical experience and ongoing learning.
At Amuktha Trading, we specialize in helping traders navigate the complexities of Bank Nifty and other derivative markets. Our services include personalized mentorship programs, real-time trading calls, comprehensive market analysis, and proven strategies tested over years of live trading. Whether you're a complete beginner or an experienced trader looking to refine your approach, our expert team can help you achieve your trading goals.
What Amuktha Offers
Daily Market Analysis: Comprehensive pre-market analysis covering Bank Nifty support-resistance levels, key levels to watch, and trading strategies for the day ahead.
Live Trading Calls: Real-time trade alerts with specific entry points, stop-losses, and targets based on proven methodologies.
Options Strategies: Weekly options selling strategies, hedging techniques, and advanced multi-leg strategies tailored to different market conditions.
Personalized Mentorship: One-on-one guidance to develop your trading plan, improve execution discipline, and build long-term trading success.
Educational Resources: Access to webinars, recorded sessions, strategy documents, and trading psychology modules.
Community Support: Join a community of like-minded traders for idea sharing, discussion, and mutual learning.
Ready to Transform Your Trading?
Don't let another opportunity pass by. Whether you want to learn Bank Nifty from scratch or optimize your existing strategies for better returns, Amuktha Trading provides the knowledge, tools, and support you need for consistent profitability.
Disclaimer:- Trading in securities markets carries substantial risk and is not suitable for everyone. Past performance is not indicative of future results. This article is for educational purposes only and should not be construed as investment advice. Please conduct your own research and consult a SEBI-registered financial advisor before making trading or investment decisions.
© 2026 Amuktha Trading. Telangana, India. Serving global traders since 2013.