Technical Analysis for Stock Market Trading in 2026: The Complete Guide for Nifty, Dow Jones & Global Markets
By Amuktha Trading & Investment Experts | Updated: 2026 | Reading time: ~12 minutes
Every day, millions of retail traders in India open their Zerodha, Groww, or Angel One dashboards and stare at a Nifty 50 chart — not quite sure what to do next. In the US, UK, Canada, Australia, and across Europe, the same thing happens with the S&P 500, Nasdaq, Dow Jones, FTSE, and DAX. The market looks like noise. But for traders who understand technical analysis, every chart tells a clear, actionable story.
This guide, updated for 2026, will teach you exactly how to read that story — from the very first candlestick to advanced multi-indicator setups used by professional traders on Nifty, Bank Nifty, Dow Jones, and Nasdaq. Whether you are a complete beginner or a trader who has been struggling to make consistent profits, this is the most practical technical analysis guide written specifically for you.
💡 Quick Takeaway: Technical analysis works the same way whether you trade Nifty 50 in Mumbai, Dow Jones in New York, or FTSE 100 in London. The price patterns, indicators, and risk rules are universal — only the instrument changes.
1. What Is Technical Analysis? (And Why It Works in 2026)
Technical analysis is the method of studying historical price movements and trading volume to predict where a stock, index, or commodity is likely to go next. It is not magic, astrology, or guesswork. It is pattern recognition and probability, built on three principles that have been proven true across every major financial market since the 19th century.
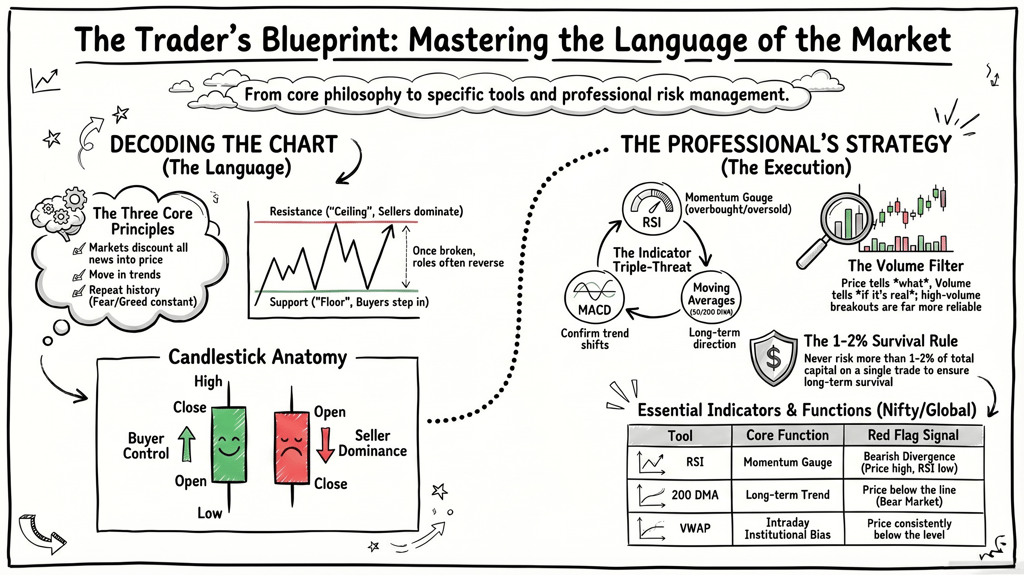
The Three Core Principles
The first principle is that the price discounts everything. Every piece of known information — company earnings, RBI policy, Fed rate decisions, FII flows, geopolitical news — is already reflected in the current price. You do not need to independently research all these factors. The chart already knows.
The second principle is that prices move in trends. Markets do not move randomly. They trend upward (bull market), downward (bear market), or sideways (consolidation). The single most powerful trading edge is identifying the dominant trend and trading with it, not against it.
The third principle is that history repeats itself. Human emotions — fear and greed — drive markets the same way they always have. That is why the same chart patterns and indicator signals keep appearing, decade after decade, on Nifty, Dow Jones, Nasdaq, and every other market worldwide.
In 2026, technical analysis is more relevant than ever. With over 17 crore demat accounts active in India alone, retail participation has exploded. F&O volumes on NSE regularly cross ₹50,000 crore per day. In this environment, understanding how to read charts is not optional — it is the minimum entry requirement for any serious trader.
Technical Analysis vs Fundamental Analysis: Which Should You Use?
Technical analysis focuses on short-to-medium term price action — minutes to weeks — using charts, patterns, and indicators. It gives you immediate, real-time signals and works best for traders active in Nifty F&O, intraday, and swing trading. Fundamental analysis, on the other hand, evaluates a company's earnings, revenue, balance sheet, and competitive position for a 3 to 5 year investment horizon. The learning curve is steeper and signals are slower — you wait for quarterly results and annual reports rather than real-time chart signals.
The smartest traders in 2026 use both: fundamental analysis to choose which stocks to trade, technical analysis to choose exactly when to enter and exit.
2. How to Read Stock Charts: Candlesticks Explained for Beginners
Before you can use any indicator or identify any pattern, you need to understand the language of charts. The candlestick chart is the universal standard used by traders in India, the US, UK, Europe, and Australia. Here is how to read every candlestick perfectly.
Anatomy of a Single Candlestick
Each candlestick represents price action over a chosen time period — 1 minute, 5 minutes, 15 minutes, 1 hour, 1 day, or 1 week. It shows four prices: the Open (the price at the start of the period), the High (the highest price reached, shown by the upper wick), the Low (the lowest price, shown by the lower wick), and the Close (the final price at the end of the period — the most important of the four).
A green or bullish candle means the close is above the open — buyers were in control. A red or bearish candle means the close is below the open — sellers were in control.
📌 Pro Tip for Nifty Traders: On the Nifty 50 daily chart, the 15-minute and 1-hour candles are most widely used by intraday traders. The daily candle is essential for swing traders and positional traders targeting 5–20% moves.
7 Powerful Candlestick Patterns Every Trader Must Know in 2026
These patterns appear repeatedly on Nifty, Bank Nifty, Dow Jones, Nasdaq, and individual stocks worldwide. Memorise them — they are the building blocks of every profitable trading setup.
Doji: Open and close are almost equal, producing a cross or plus shape. This single candle signals indecision — neither buyers nor sellers won the battle. When a Doji appears after a strong trend, it warns that a reversal may be coming. On Nifty, Doji candles near key support and resistance levels are especially significant.
Hammer (Bullish Reversal): A small real body at the top with a long lower wick at least twice the body length. It appears at the bottom of a downtrend. It means sellers pushed the price down hard during the session, but buyers came in strongly and drove it back up. This is one of the most reliable bullish reversal signals on Bank Nifty intraday charts.
Shooting Star (Bearish Reversal): The mirror image of the hammer — a small body at the bottom with a long upper wick. Appears at the top of an uptrend. Buyers tried to push the price up, but sellers overwhelmed them and pushed it back down. A classic signal to exit long positions or initiate short trades on Nifty.
Bullish Engulfing: A large green candle that completely engulfs the previous red candle's body. This two-candle pattern at the end of a downtrend signals a powerful shift in momentum from sellers to buyers. High-volume bullish engulfing patterns on the Nifty daily chart have historically preceded rallies of 3 to 8 percent.
Bearish Engulfing: A large red candle that completely engulfs the previous green candle. The opposite of bullish engulfing — appears at market tops and signals the start of a downtrend. Watch for this pattern at Nifty all-time highs or after extended rallies.
Morning Star (Strong Bullish Reversal): A three-candle pattern: a large red candle, a small-bodied candle with a gap down, then a large green candle. This pattern at Nifty support zones is one of the strongest buy signals in technical analysis. It shows a complete sentiment reversal from bearish to bullish.
Evening Star (Strong Bearish Reversal): The bearish mirror of the morning star. Three candles: large green, small-bodied gap-up candle, then large red. When this appears at Nifty resistance, Bank Nifty highs, or Dow Jones peak zones, it is a high-probability signal to reduce long positions.
⚠️ Important Rule: Never trade a candlestick pattern in isolation. Always confirm with volume, support and resistance context, and at least one indicator such as RSI or MACD. This confirmation framework is what separates consistent traders from gamblers.
3. Support & Resistance: The Foundation of All Trading Decisions
If candlestick patterns are the words of the market's language, support and resistance are the grammar. Every professional trader — whether they trade Nifty options in Chennai, swing trade US stocks from London, or scalp Nasdaq futures in Sydney — bases their decisions on support and resistance levels.
A support level is a price zone where buying pressure has historically been strong enough to stop the price from falling further. Think of it as a floor. When the Nifty 50 falls to a support zone, buyers step in aggressively. The more times a price level has acted as support, the stronger and more reliable it becomes.
A resistance level is a price zone where selling pressure has historically overwhelmed buying, preventing the price from rising further. Think of it as a ceiling. When the Nifty approaches a resistance zone, sellers become active. Breaking through resistance — called a breakout — is one of the most powerful trading signals.
The Role Reversal Rule
Once a support level is broken, it becomes resistance. Once resistance is broken, it becomes support. This role-reversal principle is one of the most consistently reliable rules in all of technical analysis, and it works on every timeframe and every global market.
How to Identify Key Levels on Nifty & Dow Jones in 2026
Start by looking at the weekly and monthly charts to identify major historical highs and lows — these are your most powerful reference points. Previous all-time highs and significant swing highs or lows carry the strongest weight. Round numbers like Nifty 22,000, 24,000, and 25,000, or Dow Jones 40,000 and 45,000, act as powerful psychological support and resistance levels — always watch these. Once you have identified the key levels on the higher timeframe, use the daily chart to refine your entry. Finally, pay attention to volume: a level tested multiple times with declining volume on each test is weakening and likely to break soon.
🎯 Real Example (2026): When Nifty 50 reclaimed the 23,500 level after a correction, that level — previously resistance — became strong support. Traders who understood role-reversal entered long positions there with defined stop-losses just below 23,200. This is textbook support and resistance trading.
4. The Most Important Technical Indicators for 2026: RSI, MACD & Moving Averages
Indicators are mathematical calculations applied to price and volume data. Used alone, they lag and give false signals. Used in combination with price action, support and resistance, and candlestick patterns, they are extraordinarily powerful. Here are the three indicators every serious trader must master.
Relative Strength Index (RSI) — Your Momentum Gauge
RSI measures the speed and magnitude of recent price changes on a scale of 0 to 100. It answers the single most useful question in trading: is this market overbought or oversold?
RSI above 70 signals overbought conditions — the market has risen too far, too fast, and momentum may be exhausted. Prepare for a reversal or pullback. RSI below 30 signals oversold conditions — the market has fallen too hard and sellers may be exhausted. Prepare for a bounce or reversal. RSI between 40 and 60 is the neutral zone with no strong signal — wait for confirmation.
The most powerful RSI signal is divergence. When price makes a new high but RSI makes a lower high, this bearish divergence is one of the most reliable early warning signals of a trend reversal. Watch for this on Nifty and Bank Nifty weekly charts.
📊 2026 Setting for Indian Traders: Use RSI(14) as default. For intraday Nifty trading, RSI on the 15-minute chart combined with the 1-hour chart gives high-probability signals. Trades taken in the direction of the hourly RSI trend, timed on the 15-minute RSI, have historically performed well on Bank Nifty.
MACD (Moving Average Convergence Divergence) — Your Trend Confirmation Tool
MACD is the most widely used trend-following indicator worldwide. It plots the difference between two exponential moving averages — typically the 12 and 26 period — and a 9-period signal line generates buy and sell signals.
When MACD crosses above the signal line, it is a bullish crossover — momentum is shifting upward. When it crosses below, it is bearish. A MACD histogram growing above zero confirms a strong bullish trend in progress. A histogram below zero and shrinking suggests the bearish trend is losing steam and a reversal may be near. Zero-line crossovers — where MACD crosses above or below zero — signal the start of new major trends and are especially reliable on Nifty weekly charts.
Moving Averages — Your Trend Direction Compass
A moving average smooths out price fluctuations to reveal the underlying trend direction. The 50-Day Moving Average (50 DMA) is the short-to-medium trend indicator — when Nifty is above its 50 DMA, the near-term trend is bullish; when below, bearish. The 200-Day Moving Average (200 DMA) is the most important indicator for long-term trend direction — Nifty trading above its 200 DMA confirms a long-term bull market; below it signals bear market territory.
The Golden Cross — when the 50 DMA crosses above the 200 DMA — is one of the most bullish signals possible on any market, including Nifty, Dow Jones, and individual stocks. The Death Cross — when the 50 DMA crosses below the 200 DMA — is a powerful bearish signal, often seen at the start of significant market downturns. Moving averages also act as dynamic support in uptrends and resistance in downtrends — price frequently bounces off the 20 EMA in strong trending markets.
Beyond RSI, MACD, and moving averages, two more indicators deserve your attention. Bollinger Bands measure volatility and identify breakout opportunities — when price touches the upper band, the market may be overextended; when it touches the lower band, a bounce is often near. VWAP (Volume Weighted Average Price) is the most important intraday level for Nifty and Bank Nifty traders — price consistently above VWAP means institutional buyers are in control; below VWAP means institutional sellers dominate.
5. Chart Patterns That Predict Major Market Moves
While candlestick patterns develop over one to three candles, chart patterns take days, weeks, or months to form. They represent the collective psychology of thousands of market participants and reliably signal major breakouts and reversals — on Nifty 50, Bank Nifty, Dow Jones, and Nasdaq alike.
Reversal Patterns
The Head and Shoulders pattern is one of the most reliable bearish reversal signals in all of technical analysis. It consists of three peaks — a higher middle peak (the head) flanked by two lower peaks (the shoulders). A neckline connects the troughs between the peaks. When price closes below the neckline on high volume, the reversal is confirmed. To calculate the target, measure the distance from the head to the neckline and project that same distance below the breakout point. This pattern has warned of significant Nifty corrections multiple times in the past decade.
The Inverse Head and Shoulders is the mirror image — three troughs with a lower middle trough. Breakout above the neckline signals a major bullish reversal and is one of the most reliable buy signals when confirmed with volume.
Double Top and Double Bottom patterns are simpler but equally powerful. Two peaks at the same resistance level form a double top — a bearish signal. Two troughs at the same support level form a double bottom — a bullish signal. These patterns are extremely common on Nifty and global indices and easy to spot even for beginners.
Continuation Patterns
The Bull Flag forms after a strong upward move (the flagpole) when price consolidates in a tight downward channel (the flag). A breakout above the upper trendline of the flag signals continuation of the uptrend, with a target equal to the flagpole length added to the breakout point. This pattern is extremely effective on momentum stocks and Bank Nifty.
The Ascending Triangle features flat resistance at the top with rising lows. Buyers are becoming more aggressive at progressively higher prices, compressing the market until resistance eventually breaks. Breakouts from ascending triangles are usually explosive and are common on Nifty 50 before major bull runs.
The Descending Triangle is the mirror — flat support at the bottom with falling highs. When that support breaks, expect a sharp downward move. This pattern is important to recognise on global indices during risk-off periods and broad market corrections.
6. Volume Analysis: The Indicator Behind the Indicators
Price tells you what is happening. Volume tells you whether to believe it. This principle is the most underused insight in retail trading, and mastering it will immediately improve the reliability of every other signal you use.
A breakout on high volume is genuine and sustainable — institutions are participating and you can trust the signal. A breakout on low volume is suspicious and may be a false breakout or bull trap — wait for confirmation before entering. When price is rising but volume is falling, the trend is weakening and losing institutional support — consider taking partial profits. When price is falling but volume is also falling, this is a healthy pullback in an uptrend where sellers are losing conviction — hold your positions. But when price is falling and volume is rising, aggressive institutional selling is underway — this is a distribution phase and you should reduce exposure.
VWAP (Volume Weighted Average Price) deserves special mention for intraday traders. It is the single most important intraday level for Nifty and Bank Nifty — price consistently above VWAP means institutional buyers are in control; consistently below VWAP means institutional sellers dominate the session.
7. Risk Management: The One Rule That Separates Survivors From Losers
You can know every candlestick pattern, every indicator, and every chart formation — and still blow up your trading account if you ignore risk management. This is the section most retail traders skip. It is also the most important section in this entire guide.
Never risk more than 1 to 2 percent of your total capital on a single trade. If your trading capital is ₹5 lakhs, your maximum loss per trade should be ₹5,000 to ₹10,000. This rule alone will prevent most retail traders from catastrophic losses.
Always define your stop-loss before entering any trade — not after. Your stop-loss should be placed just below the key technical level (support, moving average, or chart pattern breakout point) that invalidates your trade thesis. If that level breaks, your reason for being in the trade no longer exists.
Maintain a minimum risk-reward ratio of 1:2. For every ₹1 you risk, your target should deliver at least ₹2 in profit. At a 1:3 ratio, you can be right only 34 percent of the time and still be profitable over hundreds of trades. This mathematics is the foundation of long-term trading survival.
Never add to a losing position. If the market is moving against you, your initial analysis was wrong. Adding more — commonly called averaging down — turns a manageable small loss into a potentially account-destroying one. Always use position sizing consistently: the number of shares or lots you trade should be determined by your risk per trade and the distance to your stop-loss, never by how confident you feel about a particular trade.
🔑 The Mathematics of Survival: If you lose 50% of your capital, you need a 100% return just to break even. With 1% risk per trade and a 1:2 risk-reward ratio, you need to win only 34% of your trades to be profitable. Protect your capital first. Profits will follow.
8. Multi-Timeframe Analysis: How Professional Traders See the Full Picture
Amateur traders look at one chart and make decisions. Professional traders look at multiple timeframes simultaneously to understand the full market context before placing a trade. This technique — multi-timeframe analysis — dramatically reduces false signals and improves trade accuracy.
The Three-Timeframe Framework for Nifty Traders
Start with the higher timeframe — weekly or daily — to establish the dominant trend. Is Nifty in a bull trend, bear trend, or range? Never fight this trend; it is the most powerful force acting on your trade.
Move to the middle timeframe — 4-hour or 1-hour — to identify potential setup zones. Look for key support and resistance levels and areas where multiple indicators converge. Confluence of signals dramatically increases probability.
Use the lower timeframe — 15-minute or 5-minute — only to time the actual entry. Wait for a candlestick confirmation signal such as a hammer, engulfing candle, or clean breakout at the level identified on the middle timeframe.
Here is a complete example: the weekly chart shows Nifty in a strong uptrend above its 200 DMA. The daily chart shows a pullback to the 50 DMA with RSI approaching 40 — oversold territory. The 1-hour chart shows a bullish engulfing candle forming right at that 50 DMA level. This three-timeframe confluence is an A-grade setup. The weekly provides direction, the daily identifies the setup level, and the hourly provides the entry trigger.
9. Technical Analysis for Global Markets in 2026: India, US, UK & Beyond
One of the greatest advantages of technical analysis is its universality. The same principles that work on Nifty 50 work equally on the Dow Jones and Nasdaq in the United States, the FTSE 100 in the UK, the DAX in Germany, the ASX 200 in Australia, and the Nikkei 225 in Japan. Price is price. Human psychology is the same everywhere.
In 2026, India's Nifty 50 remains the benchmark for Indian equity markets, with the 23,000 to 25,000 zone serving as the key range to watch technically. Bank Nifty, driven by the performance of India's largest banks, is the most actively traded F&O instrument in the world by volume. Key technical levels on Bank Nifty weekly charts and VWAP on the intraday chart are the primary tools for options traders targeting weekly expiry setups.
The Dow Jones Industrial Average continues to serve as the primary health indicator for global equity markets. The 40,000 psychological level and the 200 DMA on the weekly chart are the two most watched technical reference points. For Nasdaq 100 traders and investors, the technology sector's relationship with its 50 DMA versus 200 DMA is the most important ongoing chart story — this relationship has historically predicted major turning points in global risk appetite.
For Indian traders following global markets, the Dow Jones and Nasdaq have a historically strong correlation with Nifty 50 opening gaps. A significant sell-off in US markets overnight typically creates a gap-down opening on Nifty the next morning. Understanding global chart patterns helps you prepare for these scenarios and position defensively rather than being caught off guard.
Gold (XAU/USD) deserves special attention in 2026 as a technically responsive safe-haven asset. The ₹2,800 to ₹3,200 range is the key zone to watch. Technical analysis of gold is directly relevant to Indian traders who invest in Sovereign Gold Bonds (SGB), gold ETFs, and MCX gold futures.
10. Your Technical Analysis Action Plan: How to Start Today
Knowledge without action is wasted. Here is a practical step-by-step action plan to implement everything in this guide immediately.
In Week 1, set up your charts. Open TradingView — the free version is sufficient. Open the Nifty 50 daily chart and add the 50 DMA in blue, the 200 DMA in red, RSI(14) below the chart, MACD(12,26,9) below that, and volume bars at the bottom. This is your core setup. Use it consistently every single session.
In Weeks 1 to 2, learn the patterns through back-testing. Go back two years on the Nifty daily chart and identify every Hammer, Doji, Engulfing candle, and Head & Shoulders pattern you can find. Note what happened in the days following each pattern. This exercise will train your pattern recognition faster than any textbook ever could.
In Weeks 2 to 4, paper trade. Simulate trades without risking real money. When you spot a setup, write down your entry price, stop-loss, and target in a trading journal. Track results honestly. Aim for at least 30 paper trades before committing real capital. This is the most important step that most beginners skip — and the most common reason beginners lose money.
In Month 2, start small with real capital. Begin with the smallest possible position sizes — one lot for Nifty F&O, or ₹5,000 to ₹10,000 positions for stocks. Apply the 1 to 2 percent risk rule strictly on every single trade. Focus entirely on following your process, not on the profits.
From Month 2 onwards, get mentored. Trading in isolation slows your progress dramatically. A good mentor or structured course can compress years of learning into months by helping you avoid the most common and expensive mistakes. Amuktha's trading mentorship programme provides personalised guidance on Nifty, Bank Nifty, and global markets, with real-time trade setups and dedicated risk management coaching.
Frequently Asked Questions About Technical Analysis (2026)
Is technical analysis reliable for Nifty trading in 2026?
Yes — technical analysis remains one of the most reliable frameworks for short-to-medium term Nifty trading in 2026. With NSE's F&O volumes exceeding ₹50,000 crore daily, price levels, chart patterns, and indicator signals are actively monitored and respected by institutional and retail participants alike. Used with proper risk management, technical analysis gives you a consistent, repeatable edge.
Which is the best indicator for Nifty intraday trading?
For Nifty and Bank Nifty intraday trading in 2026, the three most effective indicators are VWAP for identifying institutional bias, RSI(14) on the 15-minute chart for momentum and overbought/oversold levels, and the 9 EMA and 21 EMA crossover for trend direction on the 5-minute chart. Using all three together provides the best combination of trend, momentum, and entry timing signals.
How long does it take to learn technical analysis?
The basics — candlestick reading, support and resistance, and core indicators — can be learned in 4 to 6 weeks of dedicated study. Developing the discipline and pattern recognition to trade profitably typically takes 3 to 6 months of consistent practice, including paper trading. A structured mentorship programme can significantly compress this learning curve.
Can technical analysis be used for cryptocurrency trading?
Absolutely. Bitcoin, Ethereum, and other cryptocurrencies are among the most technically responsive markets in the world. The same candlestick patterns, support and resistance levels, RSI, and MACD signals that work on Nifty and Dow Jones work equally well on crypto charts. Because crypto markets are largely retail-driven, psychological levels and chart patterns tend to be even more pronounced and reliable than on traditional equity markets.
What is the difference between technical analysis and fundamental analysis?
Technical analysis focuses exclusively on price charts, volume, and mathematical indicators to predict short-to-medium term price movements — no company financials required. Fundamental analysis evaluates a company's earnings, revenue, debt, management, and competitive position to determine its intrinsic value for long-term investment. Technical analysis is best for traders; fundamental analysis is best for investors. The most successful market participants in 2026 use both approaches together.
Do technical analysis patterns work on Dow Jones and Nasdaq the same way as Nifty?
Yes. Candlestick patterns, support and resistance, moving averages, RSI, and MACD work identically on Dow Jones and Nasdaq as they do on Nifty 50. The underlying principle is universal: price reflects human psychology, and human psychology is the same in Mumbai, New York, London, Sydney, and Toronto. The practical difference lies in liquidity and volatility — US markets are deeper and react more sharply around economic data releases like US CPI, Fed interest rate decisions, and Non-Farm Payrolls.
Ready to Trade Smarter? Start Your Journey with Amuktha
You now have more practical technical analysis knowledge than the majority of retail traders who are active in the markets today. The question is: what will you do with it?
Amuktha's trading mentorship programme has helped hundreds of retail traders across India, the US, UK, and Australia move from confusion to consistent profitability — using the exact framework described in this guide. Our expert mentors provide personalised trade setups, live chart walkthroughs on Nifty, Bank Nifty, and global markets, and ongoing support to ensure you apply these principles correctly from day one.
We offer live Nifty and Bank Nifty trade setups every market session, personalised mentorship with a SEBI-aware coaching framework, dedicated support for trade queries, and courses fully accessible in English to traders across India, the US, UK, Canada, Europe, and Australia.
📞 Take the next step: Visit amuktha.com or contact us today to book a FREE 30-minute strategy session with one of our expert traders. Limited spots available.
Disclaimer:- Trading in securities markets carries substantial risk and is not suitable for everyone. Past performance is not indicative of future results. This article is for educational purposes only and should not be construed as investment advice. Please conduct your own research and consult a SEBI-registered financial advisor before making trading or investment decisions.
© 2026 Amuktha Trading. Telangana, India. Serving global traders since 2013.